Web Design
B2B Website Conversion Rate Benchmarks for 2026: What Counts as Good

Joshua Jackai
15 min

By Joshua Jackai. I am the founder of Demand Designer, a US studio that designs and builds B2B websites on HubSpot, Framer and WordPress. Published and last updated 12 October 2026; First Page Sage figures dated 18 September 2025. Industry and vendor benchmark figures were read on 12 October 2026 and will date.
A good B2B website conversion rate in 2026 sits between about 1 and 3 percent of unique visitors, depending on the industry. First Page Sage's 2025 client data puts B2B SaaS at 1.1 percent, manufacturing at 2.2 percent and HVAC at 3.1 percent. A single landing page with one offer converts higher, with a median of 6.6 percent in Unbounce's report.
Those numbers are useful as a sanity check and dangerous as a target. Every benchmark report counts conversions and visitors differently, and most B2B sites have so little traffic that a month's rate can swing by half on luck alone. This guide gives you the benchmark figures I trust, with their dates and definitions, and then the part most benchmark posts skip: how to calculate your own rate, how to tell whether a change is real, and what peer-reviewed research says about raising it.
Key takeaways
Whole-site B2B conversion rates mostly fall between 1 and 3 percent of unique visitors (First Page Sage, September 2025).
Landing pages built around one offer run higher, with a 6.6 percent median across industries (Unbounce).
Benchmarks differ because each report picks its own numerator and denominator, such as sessions or unique visitors. Check which before you compare.
On a site with a few hundred visits a month, a 2.5 percent rate can really be anything from about 1 to 6 percent.
The bigger leak is often after the form. Sabnis and colleagues (Journal of Marketing, 2013) describe the "sales lead black hole", the 70 percent of marketing leads that sales reps do not pursue.
What is a good B2B conversion rate?
A good B2B conversion rate for a whole website is around 2 percent of unique visitors, with most industries between 1.1 and 3.1 percent in First Page Sage's 2025 data. Above your industry's figure is a good sign if it rests on enough conversions; below it is a reason to look, not to panic.
First Page Sage is a US SEO agency. Its report, updated on 18 September 2025, uses its own client data from January 2022 to August 2025 and defines conversion rate as conversion actions divided by unique visitors. That definition matters, because it counts any conversion action, such as a demo request, a contact form or a content download, and it divides by people rather than visits. It is an industry source, not a peer-reviewed one, and I found no peer-reviewed study that publishes cross-industry B2B website benchmarks. I use it because it states its method and its dates. The data comes from one agency's own clients, so some industry samples may be small and skew toward companies that buy SEO.
The spread inside B2B is wide. Long sales cycles and expensive products convert lower, because the visitor is often a researcher on a buying committee rather than the person who signs. Service categories where the visitor has an urgent problem convert higher. Legal services sit at 7.4 percent in the same data, far above everything else, which may reflect urgent intent, though the source does not say why.
B2B website conversion rate benchmarks by industry
First Page Sage's 2025 data puts B2B SaaS at 1.1 percent, manufacturing at 2.2 percent, HVAC at 3.1 percent and legal at 7.4 percent of unique visitors. The full list, conversion actions divided by unique visitors, read on 12 October 2026:
B2B SaaS: 1.1 percent
Software development: 1.1 percent
Engineering: 1.2 percent
Environmental services: 1.3 percent
Transportation and logistics: 1.4 percent
IT and managed services: 1.5 percent
Medical devices: 1.6 percent
Commercial insurance: 1.7 percent
Heavy equipment: 1.7 percent
Biotech: 1.8 percent
Solar: 1.8 percent
Financial services: 1.9 percent
Construction: 1.9 percent
Pharmaceutical: 1.9 percent
Manufacturing: 2.2 percent
Printed circuit boards: 2.4 percent
Oil and gas: 2.5 percent
Industrial IoT: 2.6 percent
Real estate: 2.7 percent
Higher education: 2.8 percent
Staffing and recruiting: 2.9 percent
HVAC: 3.1 percent
Legal: 7.4 percent
Read the list as a range, not a league table. The gap between engineering at 1.2 percent and financial services at 1.9 percent is smaller than the swing you will see between two ordinary months on a small site, which I come back to below.

Why do conversion rate benchmarks disagree?
Conversion rate benchmarks disagree because each report picks its own numerator and denominator. One report divides form fills by sessions, another divides any conversion action by unique visitors, and a third only measures paid landing pages. The same site can score 1 percent on one definition and 4 percent on another.
Four choices change the number:
Sessions or people. A buyer who visits five times before filling a form counts once as a person and five times as sessions. Dividing by sessions makes the rate lower.
Which conversions count. A newsletter sign-up, a PDF download and a demo request are very different commitments. Reports that count all of them look generous.
Which pages. A landing page built for one offer, with paid traffic sent to it on purpose, converts much higher than a whole site where most visitors came to read a blog post.
Which visitors. Many analytics setups still count bots, staff and existing customers logging in.
Moe and Fader's model of online conversion in Management Science gives a good reason not to read too much into a single visit. They found that each visit plays a different role, some planned and some closer to window shopping, and that visits build up toward a purchase while a person's resistance to buying shifts with experience (Moe and Fader, 2004, doi:10.1287/mnsc.1040.0153). Their data came from e-commerce stores, not B2B sites, but the lesson carries: a visit-level rate hides a person-level process. B2B buying adds a committee on top. Steward and colleagues' review of B2B buying models from 1956 onward in Industrial Marketing Management traces how the field moved from linear stages to customer journeys with many touchpoints (Steward et al., 2019, doi:10.1016/j.indmarman.2019.05.002).
So before you compare your rate with anyone's benchmark, write down your own definition in one line: which action, divided by what, over which dates.
What is a good conversion rate for a B2B landing page?
A good conversion rate for a B2B landing page is one above the 6.6 percent median that Unbounce reports across all industries, not only B2B, so treat that figure as a rough reference. A landing page has one offer and one form, so it should beat a whole-site rate by a wide margin.
Unbounce's Conversion Benchmark Report bases that 6.6 percent median on more than 57 million conversions on pages built with its tool. It is a vendor report about landing pages, not whole websites, and I label it that way. Comparing your homepage's rate with a landing-page median is the most common mistake I see in benchmark conversations.
My own clearest example is a landing page I built in HubSpot for Y Scouts, an executive search firm. It turned 938 views into 166 form submissions, a 17.7 percent conversion rate, calculated on page views rather than unique visitors. That was a single offer sent to an interested audience, which is exactly the situation where landing pages run high. I do not claim the design alone caused it.
Is a 2.5% conversion rate good?
Yes. A 2.5 percent whole-site rate is good for B2B. It ties oil and gas and sits above most of the 23 industries in First Page Sage's 2025 data; only industrial IoT, real estate, higher education, staffing, HVAC and legal are higher. For a single landing page, 2.5 percent is below the 6.6 percent Unbounce median and worth working on.
The catch is volume. If that 2.5 percent is 5 conversions from 200 visitors, the honest range is wide, as the section on noise shows.
Is 0.7% a good conversion rate?
A 0.7 percent conversion rate is below every B2B industry figure in the First Page Sage data, so it is low for a whole site. It can still be normal if most of your traffic lands on blog posts that answer informational questions, because those readers rarely want a sales call yet. Split the rate by page type before you judge it.
Is a 10% or 12% conversion rate good?
A 10 or 12 percent conversion rate is very good for a whole B2B website and good for a landing page. When I see a whole-site figure that high, I first check the tracking: a thank-you page counted as a conversion on every reload, a chat widget firing a conversion event on open, or a denominator that only includes one campaign.
Is a 30% conversion rate good?
A 30 percent conversion rate is exceptional and usually means a narrow context: a webinar sign-up page sent to an existing email list, a gated report promoted to past customers, or a form that counts something small like a newsletter tick box. It is a real result in those settings. It is not a target for a B2B homepage.
How do I calculate a conversion rate?
To calculate a conversion rate, divide the number of conversions by the number of visitors in the same period and multiply by 100. If 4,000 unique visitors produced 80 demo requests last quarter, your conversion rate is 80 divided by 4,000, times 100, which is 2 percent.
The formula is simple. The discipline is in the inputs:
Use the same date range for both numbers.
Pick one conversion action per rate. Track a separate rate for demo requests, contact forms and downloads.
Say whether the visitors are sessions or users, and stay with that choice.
Remove internal traffic and known bots before you divide.
How do I calculate a lead conversion rate?
To calculate a lead conversion rate, divide the number of leads that reached the next stage by the total leads in the period, then multiply by 100. If 80 demo requests produced 20 qualified sales opportunities, the lead-to-opportunity rate is 25 percent.
Track this one per stage: visitor to lead, lead to qualified lead, qualified lead to opportunity, opportunity to customer. Each stage has its own owner and its own fix.
Is my conversion rate real or just noise?
On a low-traffic B2B site, much of the month-to-month change in conversion rate is noise. Five conversions from 200 visitors is 2.5 percent, but a 95 percent Agresti-Coull interval for that result runs from about 0.9 to 5.9 percent. You cannot tell 2 percent from 4 percent on that much data.
Agresti and Coull showed in The American Statistician that the textbook interval for a proportion behaves badly with small samples and rates near zero, and recommended a simple adjusted interval, now named after them, that roughly adds two successes and two failures, or the closely related Wilson score interval (Agresti and Coull, 1998, doi:10.1080/00031305.1998.10480550). Conversion rates are exactly that case. I ran the Agresti-Coull interval on three versions of a 2.5 percent rate (the Wilson interval gives slightly narrower ranges):
2 conversions from 80 visitors: 2.5 percent, plausible range about 0.2 to 9.2 percent
5 conversions from 200 visitors: 2.5 percent, plausible range about 0.9 to 5.9 percent
25 conversions from 1,000 visitors: 2.5 percent, plausible range about 1.7 to 3.7 percent

The practical rule I use: do not react to a monthly rate until it rests on at least a few dozen conversions. Compare quarters instead of months, or pool a longer window. When you run a real test, size it first. Kohavi and colleagues' guide to online controlled experiments in Data Mining and Knowledge Discovery explains why tests need enough users to detect the change you care about, and how underpowered tests produce confident-looking wrong answers (Kohavi et al., 2009, doi:10.1007/s10618-008-0114-1). Most B2B sites do not have the traffic for a clean A/B test on a single button colour. They do have enough to test a page that changes the offer.
What is a good lead conversion rate?
There is no reliable single benchmark for B2B lead conversion rate, because companies define a qualified lead differently and vendor reports rarely publish their method. A better question is how many of your leads get a real follow-up, because that is where research shows the largest loss.
Sabnis, Chatterjee, Grewal and Lilien open their Journal of Marketing study with the "sales lead black hole", the 70 percent of marketing-generated leads that sales reps do not pursue. Using data from 461 sales reps at four firms, they found that how much time reps give marketing leads depends on how well leads are prequalified, whether managers track follow-up, how many leads arrive, and the rep's own experience (Sabnis et al., 2013, doi:10.1509/jm.10.0047). Experienced reps responded more to good prequalification and less to being tracked.
That is a website problem as much as a sales problem. A form that asks the right two qualifying questions does some of the prequalification for the rep. Monat's review of lead scoring in Marketing Intelligence and Planning found 16 lead characteristics that stand in for 8 purchase factors, and concluded that no single scoring model fits every company (Monat, 2011, doi:10.1108/02634501111117610). His model was not field tested, so treat it as a checklist for choosing your own qualifying questions, not a formula.
What is a good conversion rate for a funnel?
A good funnel conversion rate is the product of your stage rates, so it is always small. A site that turns 2 percent of visitors into leads, 25 percent of leads into opportunities and 25 percent of opportunities into customers converts about 0.125 percent of visitors into customers, or 1 in 800.
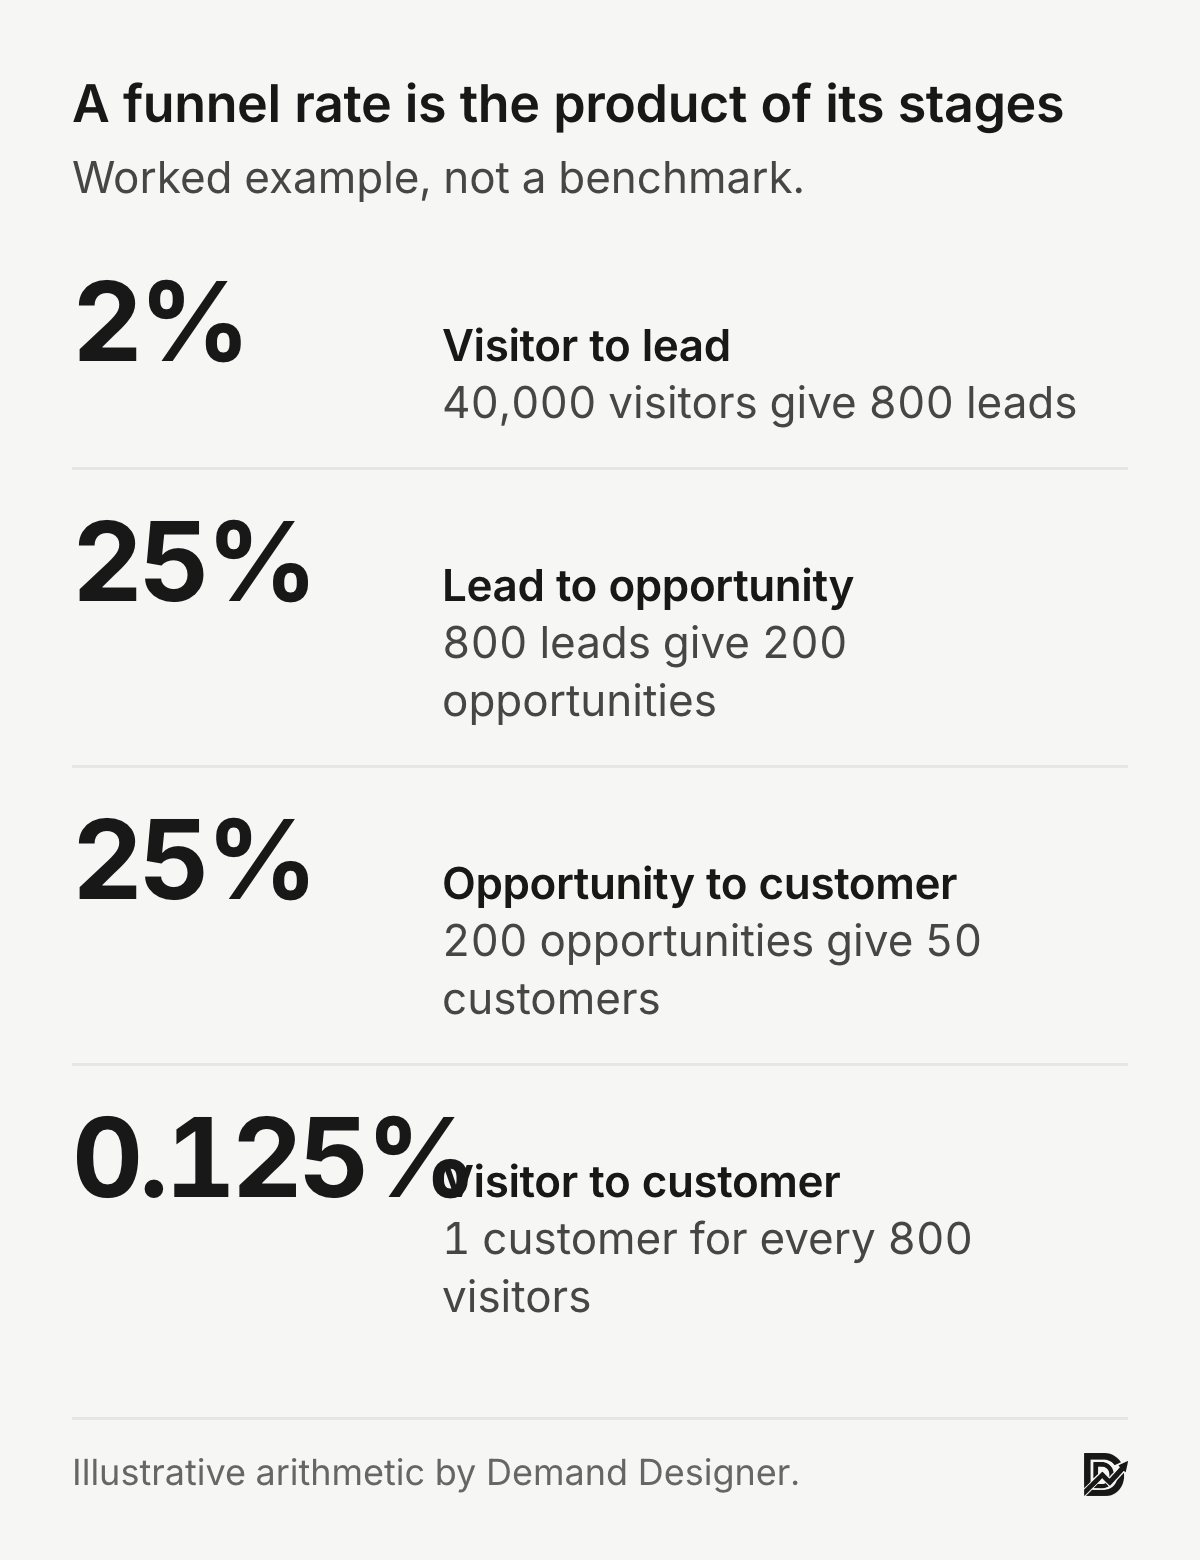
That multiplication is why I look at the whole funnel before touching the website. Raising the visitor-to-lead rate from 2 to 2.5 percent adds a quarter more leads. Raising lead follow-up from half of leads to all of them doubles what sales sees, without one extra visitor. Write down your four stage rates for last quarter. The weakest stage, compared with your own history, is where to start.
What is the difference between CVR and CTR?
CVR, conversion rate, is the share of visitors who complete an action such as a form. CTR, click-through rate, is the share of people who saw a link, ad or search result and clicked it. CTR measures attention before the visit; CVR measures what happens after it.
You want a higher CTR and a higher CVR, but chasing one can hurt the other. An ad that promises something the page does not deliver can lift CTR and sink CVR. In the B2B ad work I have done, the useful number is cost per qualified lead, which combines both.
What is conversion rate optimization (CRO)?
Conversion rate optimization, or CRO, is the practice of raising the share of visitors who take a valuable action, by finding where people drop out and changing the page, offer or flow, then measuring the result. Good CRO starts from evidence about the visitor, not from a list of button tweaks.
In B2B, I treat CRO as three jobs: make the right visitor sure they are in the right place, make the next step cheap to take, and make sure someone acts on the lead. The Pipeline Leak Scorecard walks through all three on your own site. I wrote a longer guide on conversion rate optimization for B2B for the full process.
How can I improve my website conversion rate?
To improve a B2B website conversion rate, work on four areas with peer-reviewed support: page speed, first impression, form design and lead follow-up. Start with whichever is weakest on your own site, and measure each change over a long enough window. None of these studies measured B2B conversion rates, so treat them as direction, not proof of lift. These fixes usually cost less than a redesign.
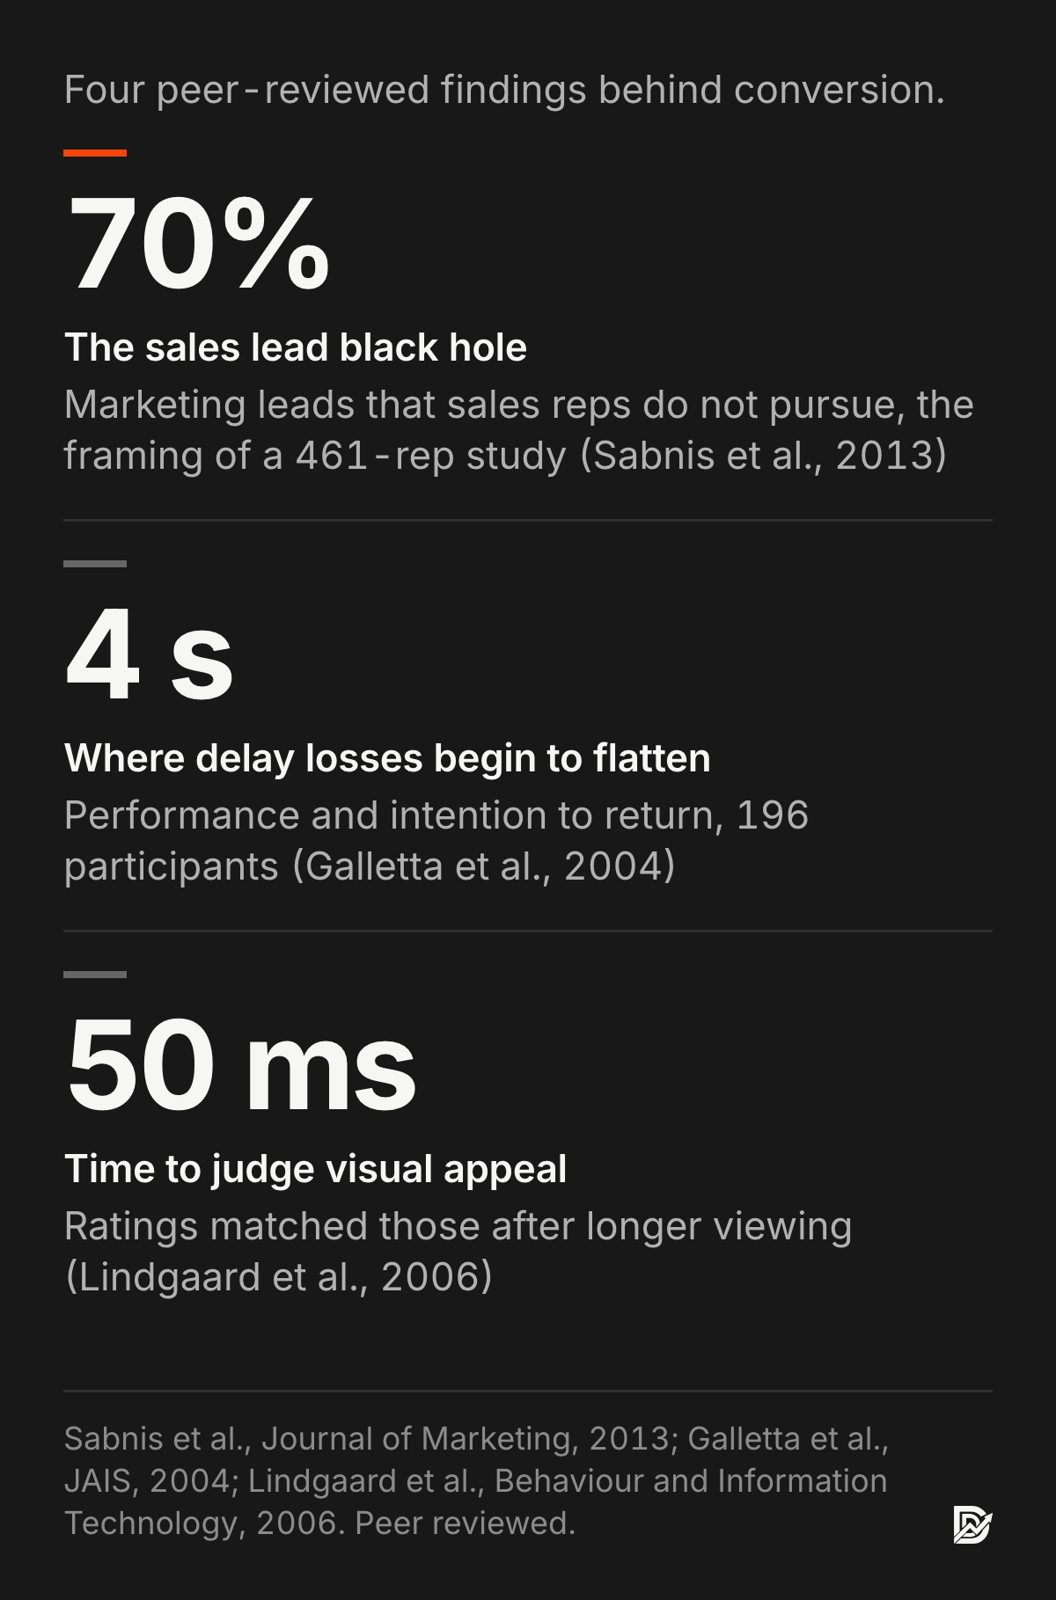
Speed. Galletta and colleagues tested page delays from 0 to 12 seconds with 196 participants in the Journal of the Association for Information Systems. Losses in task performance and in intention to return grew with delay and only began to level off at about 4 seconds, with attitudes levelling off at about 8 seconds (Galletta et al., 2004, doi:10.17705/1jais.00044). Nah's study in Behaviour and Information Technology put tolerable waiting time for a web page at about 2 seconds, longer when people saw progress feedback (Nah, 2004, doi:10.1080/01449290410001669914). Both are older lab studies, so read them as direction, not a precise threshold.
First impression. Lindgaard and colleagues found people rated a page's visual appeal after 50 milliseconds, and those ratings correlated strongly with ratings given after longer viewing (Lindgaard et al., 2006, doi:10.1080/01449290500330448). Fogg and colleagues found that 46.1 percent of comments in a study of 2,684 people judging websites' credibility mentioned the design look (Fogg et al., 2003, doi:10.1145/997078.997097). Neither study measured form completion, so the link to conversion is my inference, but it is the one I see on client sites.
Forms. Seckler and colleagues applied 20 web form guidelines to real company forms and tested them with 65 participants using eye tracking. The improved forms were completed faster, needed fewer submission attempts and were rated more satisfying (Seckler et al., 2014, doi:10.1145/2556288.2557265). Clear labels, inline error messages and asking only what you will use are the cheapest fixes on most B2B sites.
Follow-up. The Sabnis study above is the reminder that a converted visitor is not yet a lead anyone has worked. Route every form to a named person, track response time and prequalify inside the form.
What results have I seen on real B2B sites?
On B2B sites I have built, the biggest conversion gains coincided with putting the website and the CRM on the same system and with tightening the offer, not with cosmetic changes. These are client results measured in the clients' own reporting, and other changes happened at the same time.
Y Scouts: a HubSpot landing page converted 938 views into 166 submissions, 17.7 percent. The offer was specific and the form wrote straight into the record recruiters worked from; I cannot isolate which change mattered most.
Snappy Kraken: I took the site from Figma to a live HubSpot build in 21 days. The rebuild contributed to a 30 percent rise in marketing qualified leads and a 28 percent rise in click-through rate.
Advisor Websites: the work contributed to a 58 percent rise in organic traffic and a 28 percent rise in MQL conversion.
None of these is a benchmark for your site. They show the order of effect that is possible when the offer, the page and the follow-up are fixed together.
How do I benchmark my own B2B website this week?
To benchmark your own B2B website, compare it with its own past, split by page type and conversion action, and only then check it against an industry range. A one-hour version looks like this:
Step 1: Pull the last two full quarters of unique visitors and conversions from your analytics, with internal traffic filtered out.
Step 2: Split conversions by action: demo or contact request, download, newsletter.
Step 3: Split visitors by entry page type: homepage, service pages, blog, landing pages.
Step 4: Calculate each rate and its Agresti-Coull interval. Flag any rate built on fewer than 30 conversions as unreliable.
Step 5: Compare the whole-site demo or contact rate with your industry's First Page Sage figure, and each landing page with the 6.6 percent Unbounce median.
Step 6: Pull the lead-to-opportunity rate from your CRM for the same quarters.
Step 7: Pick the weakest stage against your own history and fix that one first.
If you would rather have a second pair of eyes on it, the Pipeline Leak Scorecard takes about fifteen minutes with your site open.
Sources
Peer reviewed
Agresti, A., and Coull, B. A. (1998). Approximate is better than "exact" for interval estimation of binomial proportions. The American Statistician, 52(2). doi:10.1080/00031305.1998.10480550
Fogg, B. J., Soohoo, C., Danielson, D. R., Marable, L., Stanford, J., and Tauber, E. R. (2003). How do users evaluate the credibility of Web sites? Proceedings of DUX 2003. doi:10.1145/997078.997097
Galletta, D. F., Henry, R., McCoy, S., and Polak, P. (2004). Web site delays: How tolerant are users? Journal of the Association for Information Systems, 5(1). doi:10.17705/1jais.00044
Kohavi, R., Longbotham, R., Sommerfield, D., and Henne, R. M. (2009). Controlled experiments on the web: Survey and practical guide. Data Mining and Knowledge Discovery, 18. doi:10.1007/s10618-008-0114-1
Lindgaard, G., Fernandes, G., Dudek, C., and Brown, J. (2006). Attention web designers: You have 50 milliseconds to make a good first impression! Behaviour and Information Technology, 25(2). doi:10.1080/01449290500330448
Moe, W. W., and Fader, P. S. (2004). Dynamic conversion behavior at e-commerce sites. Management Science, 50(3). doi:10.1287/mnsc.1040.0153
Monat, J. P. (2011). Industrial sales lead conversion modeling. Marketing Intelligence and Planning, 29(2). doi:10.1108/02634501111117610
Nah, F. F.-H. (2004). A study on tolerable waiting time: How long are Web users willing to wait? Behaviour and Information Technology, 23(3). doi:10.1080/01449290410001669914
Sabnis, G., Chatterjee, S. C., Grewal, R., and Lilien, G. L. (2013). The sales lead black hole: On sales reps' follow-up of marketing leads. Journal of Marketing, 77(1). doi:10.1509/jm.10.0047
Seckler, M., Heinz, S., Bargas-Avila, J. A., Opwis, K., and Tuch, A. N. (2014). Designing usable web forms: Empirical evaluation of web form improvement guidelines. Proceedings of CHI 2014. doi:10.1145/2556288.2557265
Steward, M. D., Narus, J. A., Roehm, M. L., and Ritz, W. (2019). From transactions to journeys and beyond: The evolution of B2B buying process modeling. Industrial Marketing Management, 83. doi:10.1016/j.indmarman.2019.05.002
Industry and vendor (not peer reviewed)
First Page Sage. B2B Conversion Rates by Industry. Updated 18 September 2025, client data January 2022 to August 2025. Read 12 October 2026.
Unbounce. Conversion Benchmark Report. Median landing page conversion rate 6.6 percent across industries. Read 12 October 2026.
First party: Demand Designer client results for Y Scouts, Snappy Kraken and Advisor Websites, measured in the clients' own reporting.
Free workbook
Pipeline Leak Scorecard
Find the leaks between your traffic and your pipeline. Score your site in about fifteen minutes, with it open in front of you.
12 questions, 8 pages, 15 minutes. Free.


