Landing Pages & Funnels
Web Design
B2B Conversion Rate Optimization: Guide, Services, Costs

Joshua Jackai
16 min

B2B conversion rate optimization is the work of getting more of the right visitors to take the next step with you, measured by qualified conversations and won deals rather than form fills. This guide is for founders and marketing leads at B2B service companies in the US and abroad whose sites get hundreds or a few thousand visits a month, not millions. Most CRO advice is written for that bigger audience, and much of it breaks at smaller numbers. Below is the process I use at Demand Designer: what to measure, the five fixes that move qualified leads, and how to test changes honestly when your traffic is modest.
What B2B conversion rate optimization measures
A conversion is whatever the page asks for: a booked call, a demo request, a quote form, a download. The conversion rate is the share of visitors who do it. That number is useful, but in B2B it can mislead you. A page that doubles form fills by attracting students and job seekers has a higher conversion rate and a worse pipeline.
So I track three rates in a row, and one number that ties them together:
Visit to lead: the share of visitors who book, request or download.
Lead to qualified: the share of those leads that match your buyer and have a real need.
Qualified to won: the share of qualified leads that become clients.
Revenue per visitor: revenue won from the site divided by visitors over the same period. It is the one figure that rises only when the whole chain improves.
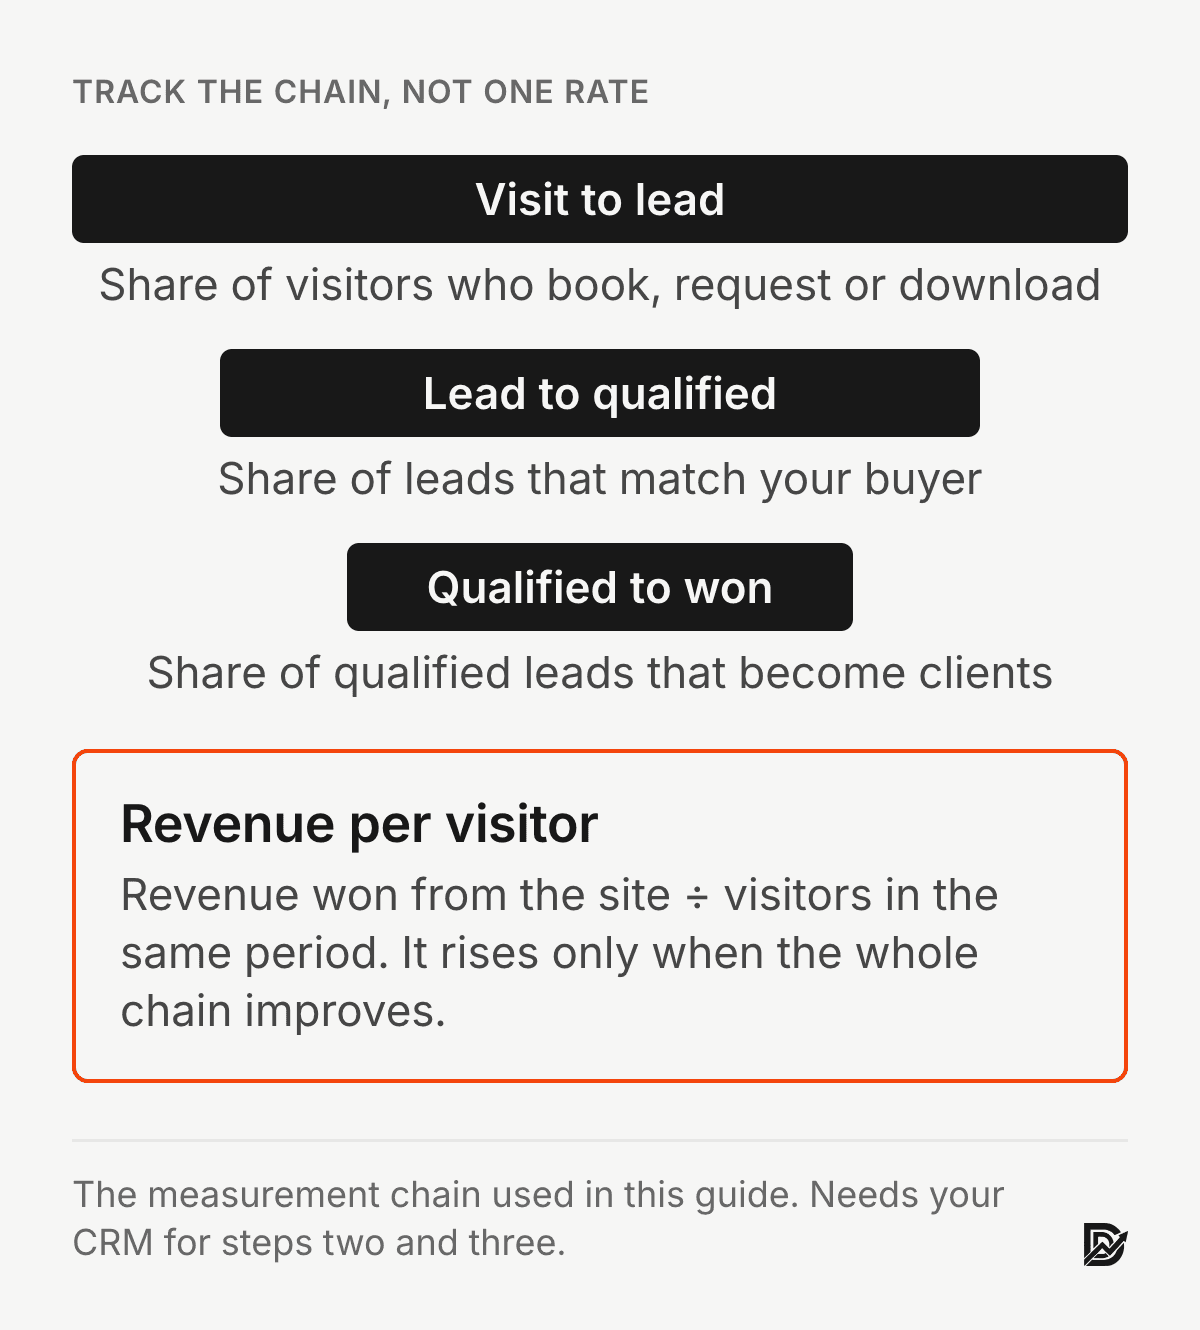
You need your CRM for the second and third rates. If leads land in an inbox and nobody tags them, fix that first. Without it, every change you make is judged on the least useful number you have.
Why conversion rate optimization works differently for B2B
Three things separate B2B sites from the online shops most CRO case studies come from.
The buyer is a group. One person finds you, two or three others review you, and someone with budget signs off. Your pages need to work for each of them, including the colleague who arrives by a forwarded link and never saw your homepage.
The cycle is long. A visitor who reads your case study today may book a call in six weeks. A test that runs for two weeks measures interest, not revenue.
Traffic is low and each lead is valuable. A shop with 200,000 monthly visitors can test button colours. A consultancy with 3,000 visitors and a $25,000 average engagement cannot, and does not need to. One extra qualified lead a month matters more to it than any button.
That last point shapes everything that follows. Low traffic changes how you find problems, which fixes you make first, and how you prove a change worked.
B2B website conversion rate benchmarks, and the one that matters
You will find B2B website conversion rate benchmarks quoted everywhere, usually in the low single digits. Treat them with care. They come from software vendors' own customer data (not peer-reviewed research), they mix industries and traffic sources, and they count every form fill as a conversion.
The benchmark that matters is your own last 90 days, split by traffic source. Paid search, organic search, referrals and email convert at very different rates, so a blended average hides what is happening. Write down visit to lead, lead to qualified and qualified to won for each source. That is your baseline, and every change below is measured against it.
Step 1: Map the funnel and find the biggest leak
Before changing a page, find where buyers drop out. I use three free tools together:
Google Analytics 4 for the path: which pages lead to a conversion, and which pages people leave from.
Microsoft Clarity for behaviour: session recordings, scroll depth and "rage clicks" where people tap something that does nothing.
Your CRM for quality: which pages and sources produce leads that turn into clients.

Illustrative photo.
Then rank the leaks by money, not by size. A pricing page that loses 80% of a small number of high-intent visitors can cost more than a blog post that loses 95% of casual readers. Start with the pages closest to the booking: your service pages, pricing, case studies and the booking or contact page itself.
If you want a structured way to do this, the Pipeline Leak Scorecard walks through 12 questions with your site open in front of you and takes about 15 minutes.
Step 2: Make the offer clear in the first screen
A common leak on B2B pages is the first screen: the visitor cannot tell what is being offered, to whom, or what happens next. A headline such as "Solutions that drive growth" could belong to anyone.
There is a reason clarity converts. Research on processing fluency shows that people judge things they can take in easily more favourably, and treat that ease as a signal that something is right for them (Reber, Schwarz and Winkielman, 2004). A page that makes the visitor work to understand it is judged more harshly before they reach your proof.
Check each key page against three questions:
What is it? Name the service in plain words: "Website redesigns for B2B software companies," not "Digital transformation."
Who is it for? Name the buyer or the situation, so the right visitor recognises themselves and the wrong one leaves early.
What happens next? Say what the button leads to: "Book a 15-minute call," not "Get started."
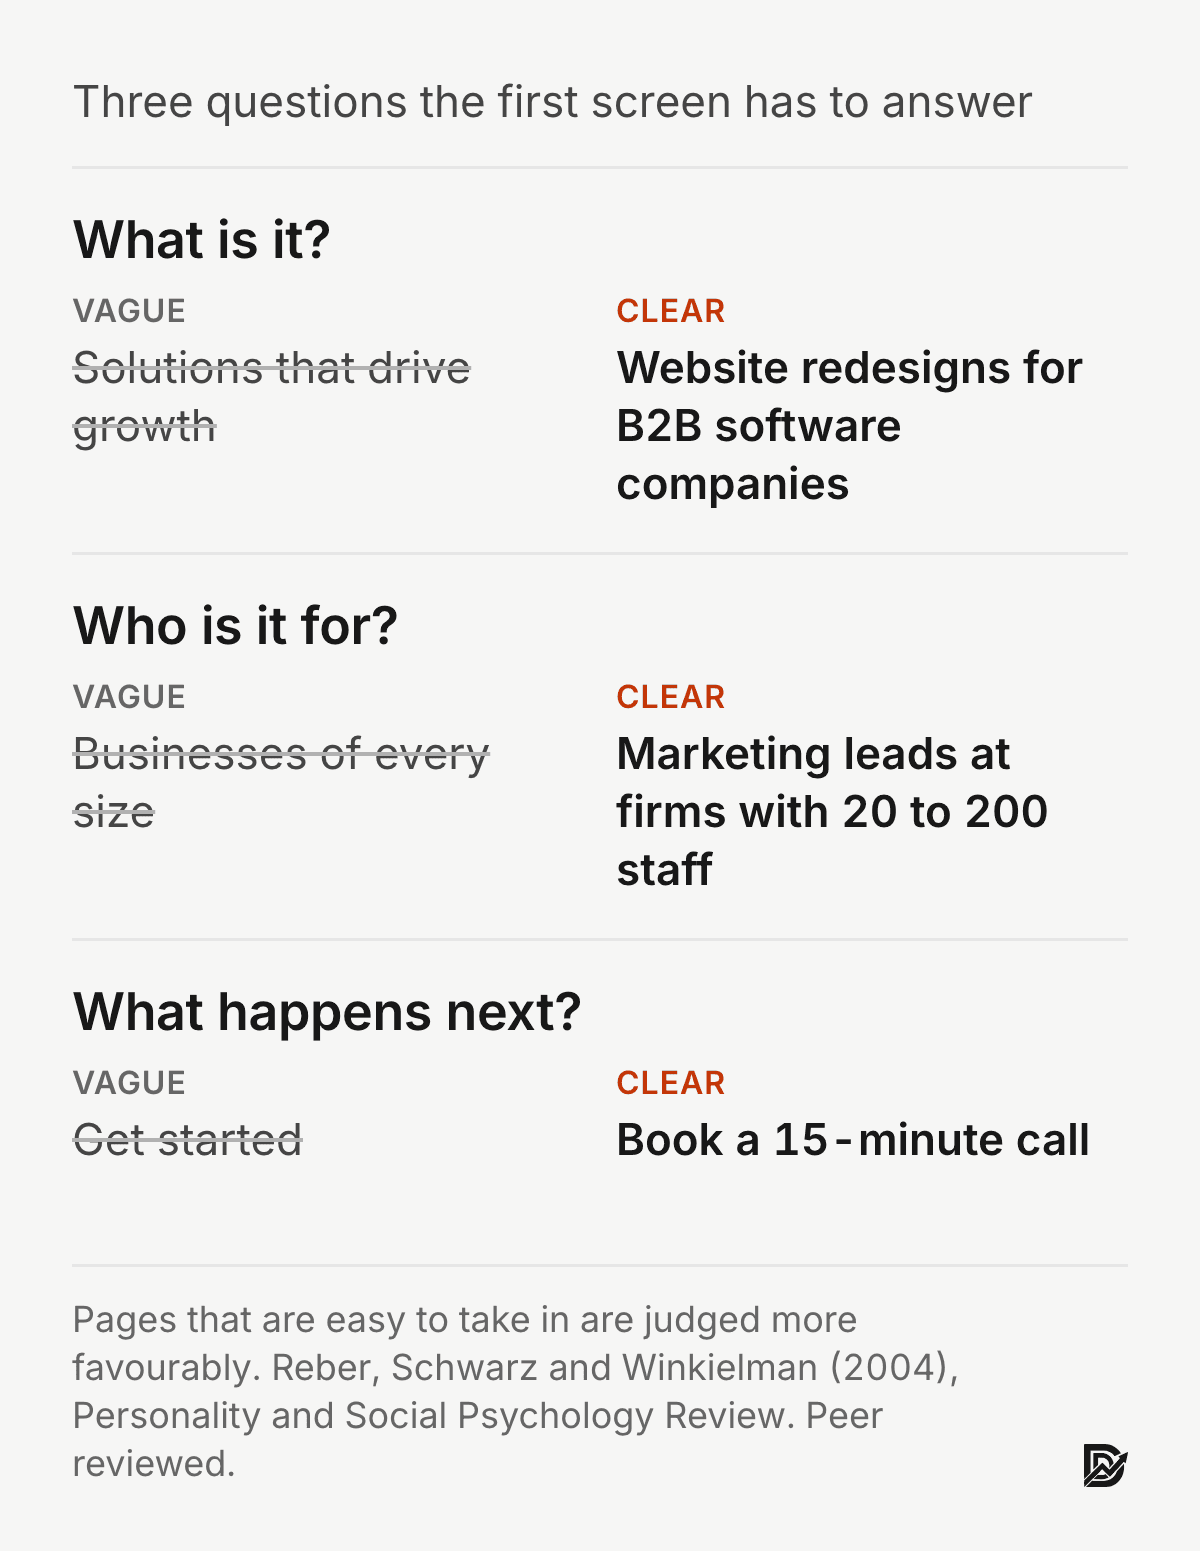
Then match the page to the traffic that lands on it. If an ad promises a free audit, the page it links to should lead with the free audit. Mismatched messages are one of the most common leaks in paid campaigns, and one of the cheapest to fix. The anatomy of a B2B landing page shows how each section should hand off to the next. And if you are tempted to generate page variations with AI to test more ideas, read why AI-generated landing pages do not convert first.
Step 3: Put proof beside every claim
B2B buyers are spending someone else's money and putting their name on the decision, so they look for reasons to trust you before they look for reasons to buy. In a Stanford study of more than 2,600 people judging real websites, the look and design of a site was the factor they mentioned most often, in close to half of all comments (Fogg et al., 2003). People take a site's quality as evidence of the company's quality.
The fix is placement: put evidence directly next to the claim it supports, rather than on a separate testimonials page nobody visits.
Beside a claim about speed, show a real timeline from a past project.
Beside a claim about results, show the number, the client and the timeframe.
Beside the booking button, answer the last objection: price range, contract length, or who they will actually work with.
Specific claims are easier to believe than impressive ones. "A book funnel that converts 17.7% of its visitors into leads" is more believable than "industry-leading results." I cover this placement in more depth in how to build trust on a website.
Step 4: Cut friction from forms and booking
Every field, step and surprise between the decision and the booking costs you leads. A controlled study of web forms tested 20 design guidelines, including clear labels, sensible field order and helpful error messages, and found that people filled in the improved forms faster, made fewer errors and needed fewer attempts to submit (Seckler et al., 2014).

The real Y Scouts form I built: four fields, one of them about the visitor's problem. Shown in an illustrative scene.
For B2B, there is a trade-off. Fewer fields bring more leads, but qualifying fields bring better ones. My rule of thumb:
Ask only for what you need to reply well: name, work email, company, and one question about the problem.
Move everything else to the call or a follow-up form after booking.
Offer a calendar embed for visitors who are ready, and a lighter option, such as a guide or scorecard, for those who are not.
Remove surprises. If the next step is a sales call, say so before they submit.
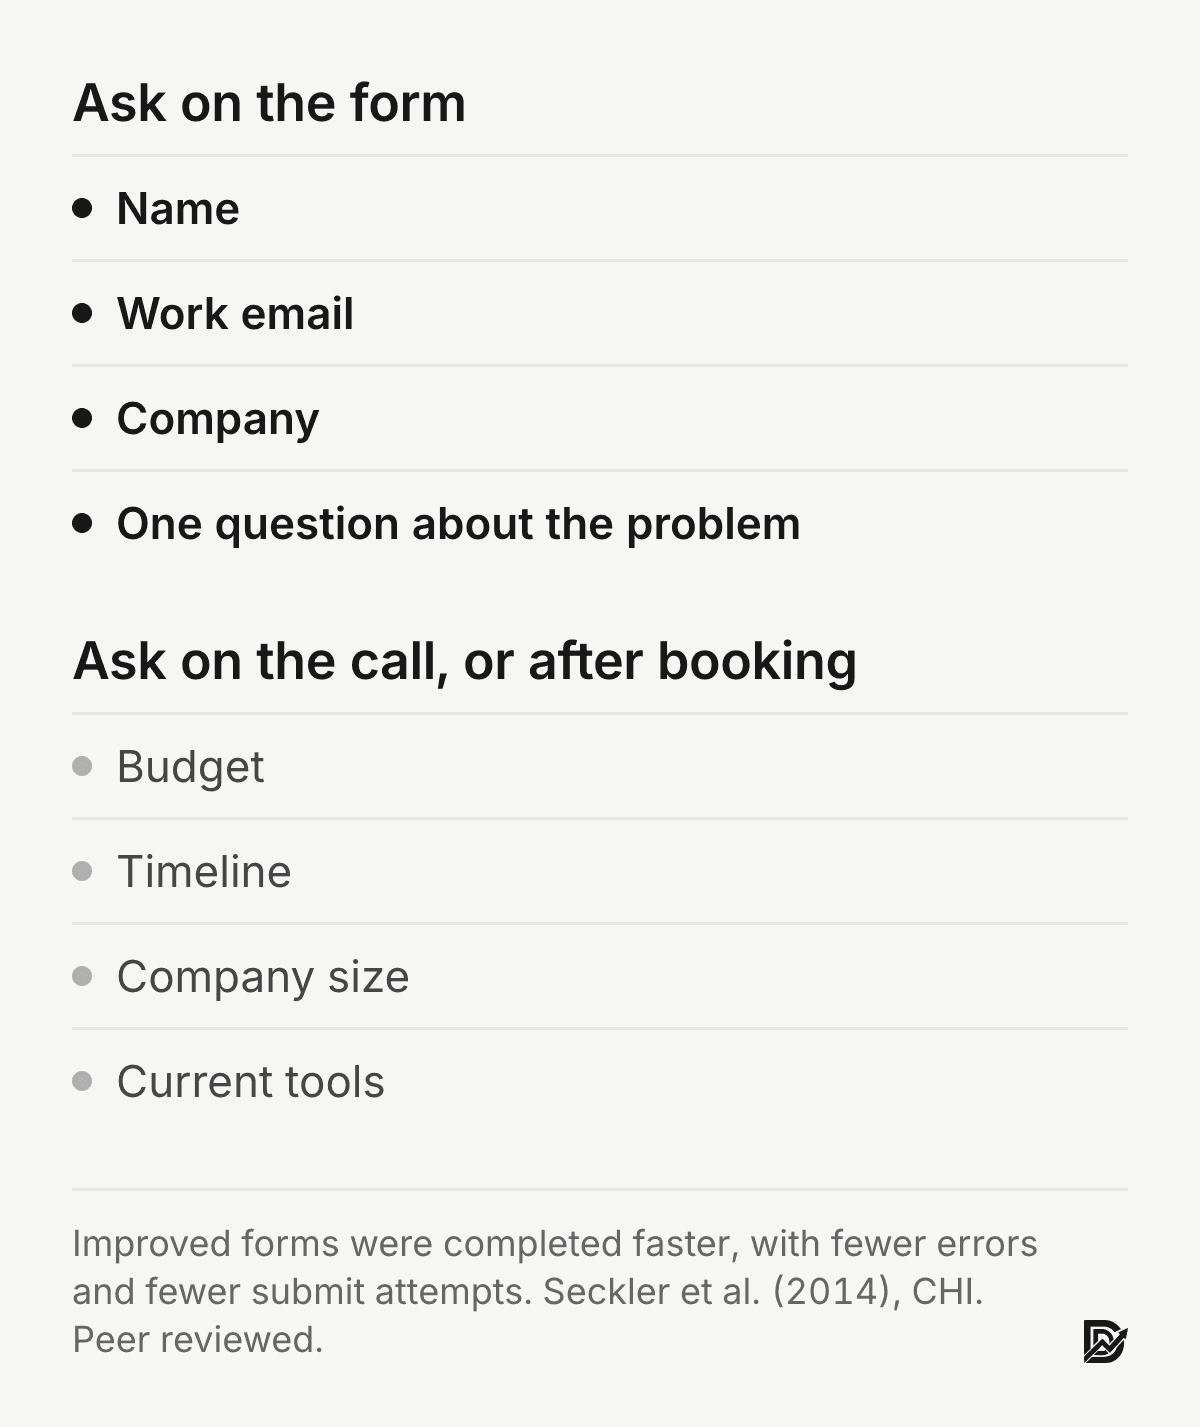
Then check the boring parts: that the form works on phones, that error messages explain what is wrong, and that the confirmation page tells people what happens next and when.
Step 5: Make the pages fast
Slow pages lose visitors before your message has a chance. In an experiment that added delays of up to 12 seconds to a website, people performed worse on their tasks and reported weaker intentions to return as the delay grew (Galletta et al., 2004). Buyers on phones and slow office networks feel this most.
Aim for Google's "good" threshold for Largest Contentful Paint, under 2.5 seconds, on your key pages. The usual causes on B2B sites are large hero videos, uncompressed images, heavy chat widgets and too many tracking scripts. Remove what you do not use, compress what you keep, and test with PageSpeed Insights on a phone setting, not just desktop.
Step 6: Test honestly when traffic is low
This is where most CRO advice fails B2B companies. A/B testing works, but it needs more visitors than many B2B sites get.
Here is the arithmetic. A common rule of thumb for an A/B test with standard confidence and power is about 16 × p × (1 − p) ÷ d² visitors per version, where p is your current conversion rate and d is the change you want to detect (Kohavi, Tang and Xu, 2020). If your page converts at 3% and you want to detect a 20% relative lift, from 3% to 3.6%, you need about 13,000 visitors for each version. That is 26,000 visitors in total. A page with 1,500 visits a month would need well over a year.
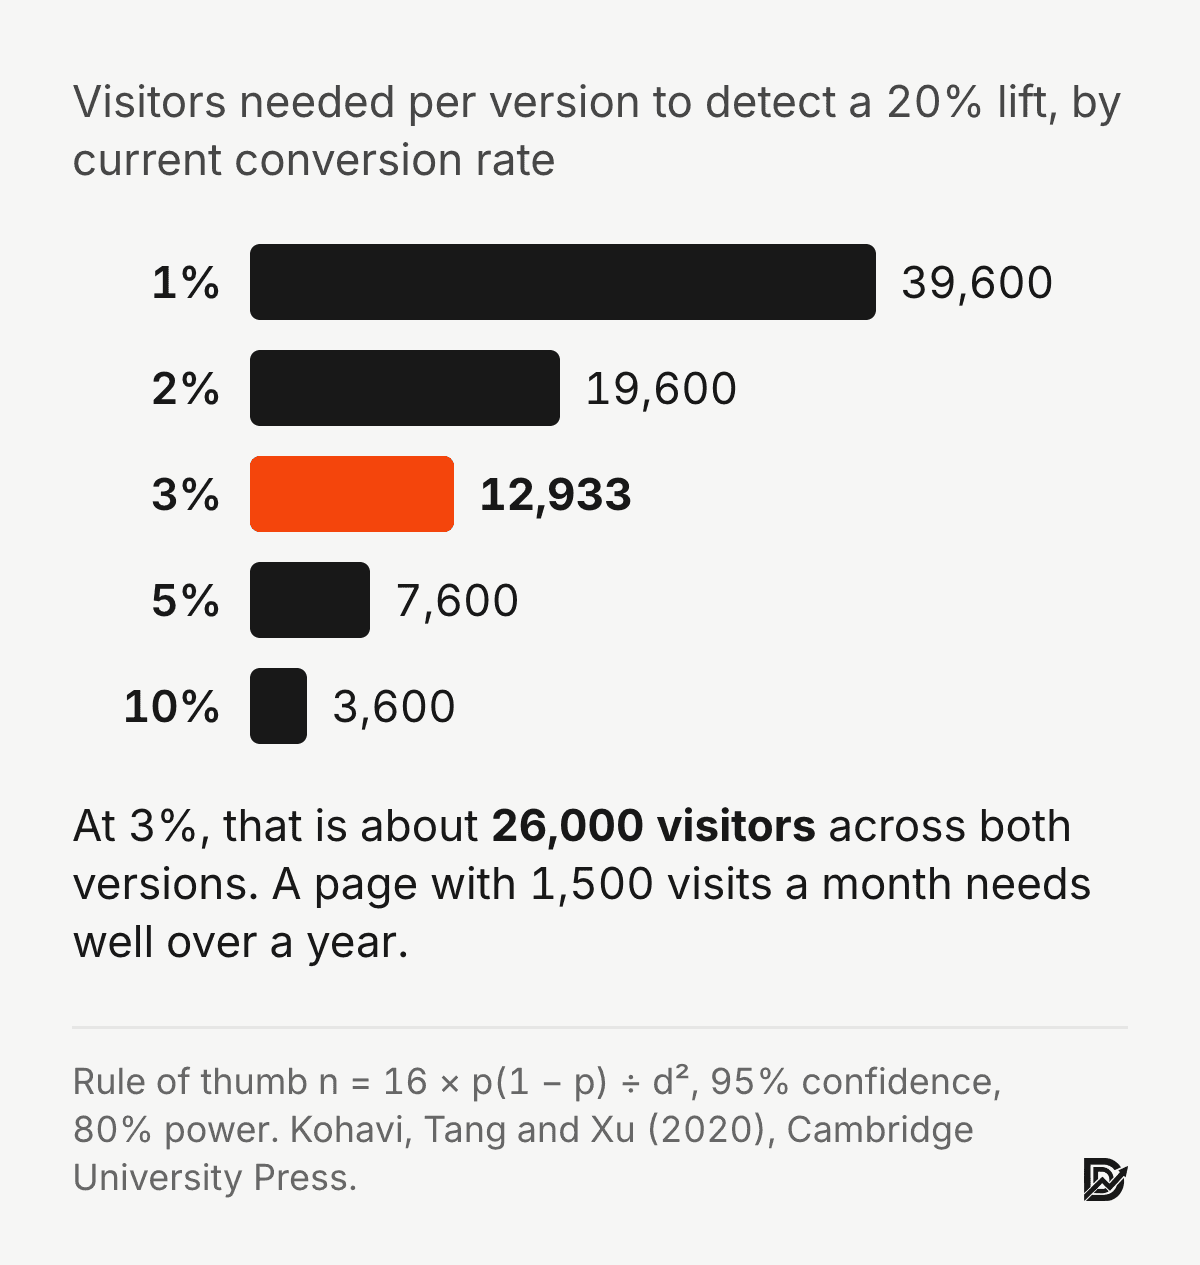
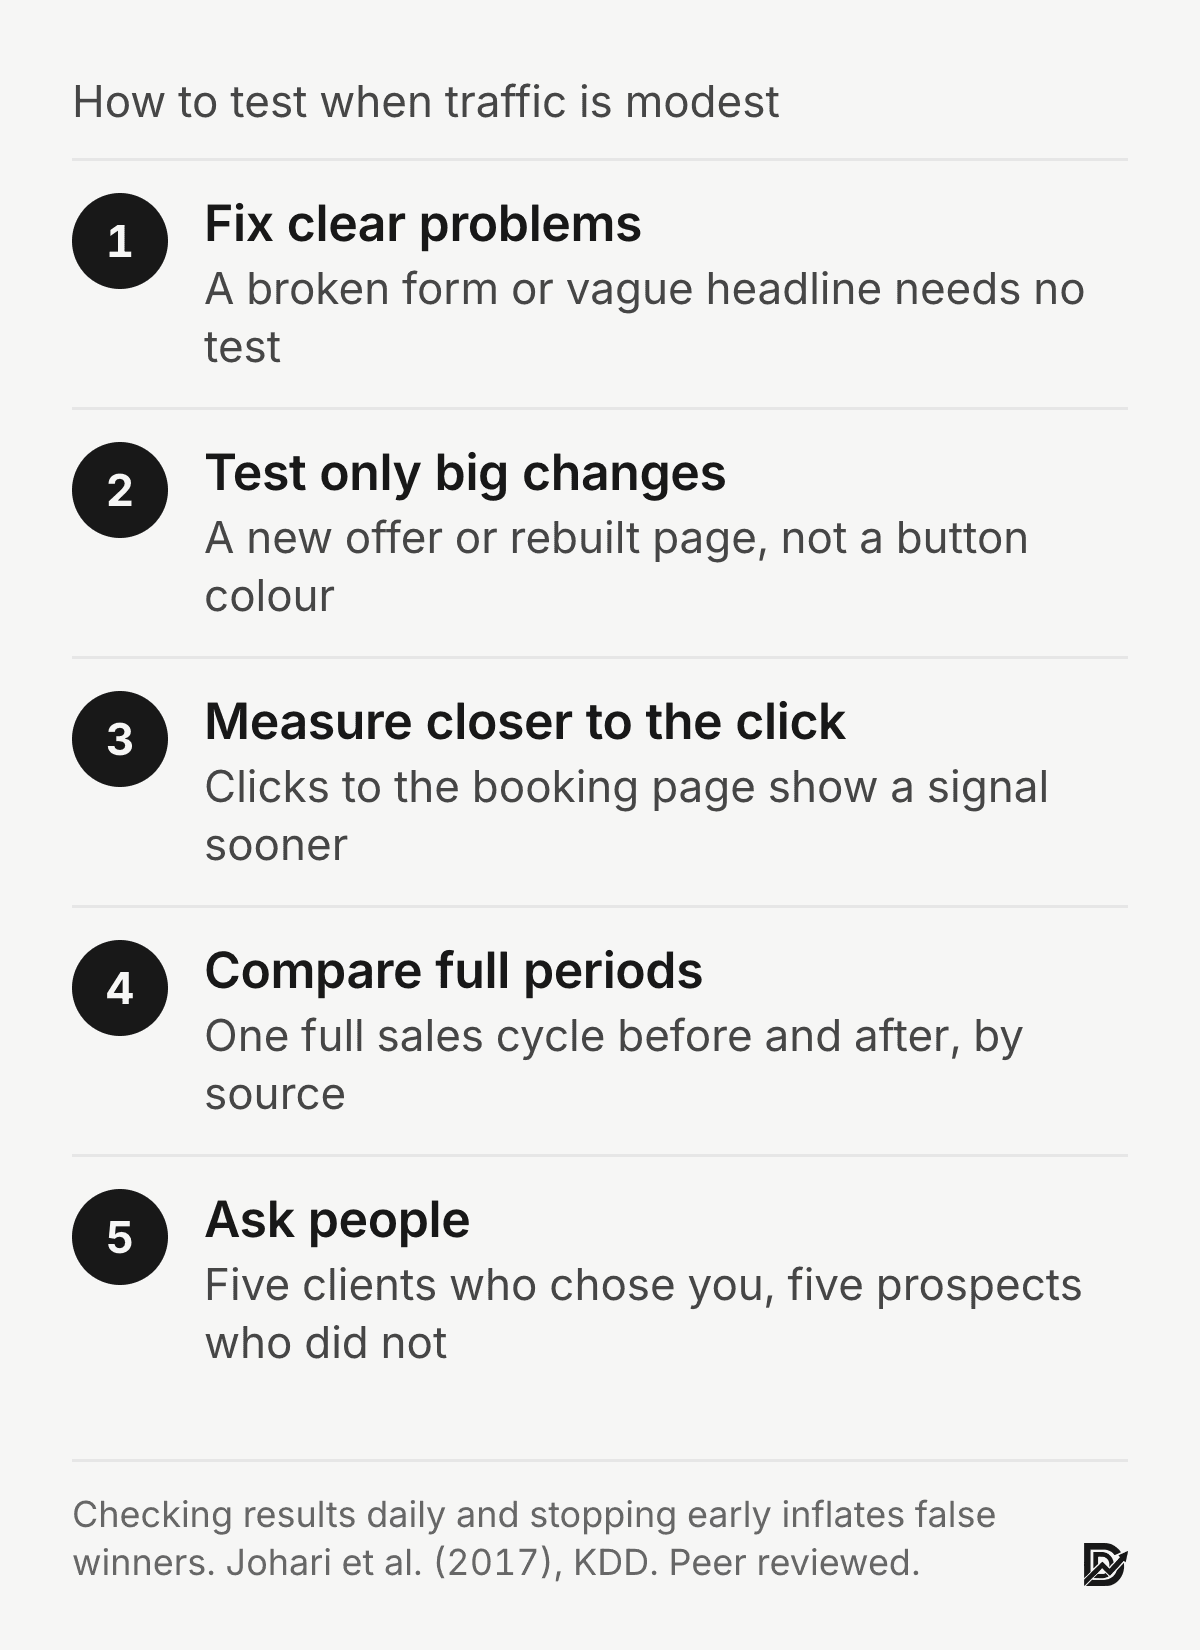
There is a second trap. If you check results every day and stop when a version looks ahead, your chance of crowning a false winner rises sharply (Johari et al., 2017). Most "winning" tests on small sites are noise caught at a lucky moment.
So with modest traffic, I use a different toolkit:
Fix clear problems without testing. A broken form, a missing price range or a headline nobody understands does not need a test. Fix it and move on.
Test only big changes. If you test, test a new offer or a rebuilt page, not a button colour. A 50% lift at a 3% conversion rate needs about 2,000 visitors per version, which is within reach.
Measure closer to the click. Track clicks to the booking page alongside completed bookings. More of those happen, so you see a signal sooner. Then confirm it with bookings over time.
Compare full periods. Compare a full sales cycle before a change with a full cycle after it, by traffic source, and note anything else that changed, such as ad spend or seasonality.
Ask people. Five conversations with recent clients about why they chose you, and five with prospects who did not, often find more than a quarter of testing.
Step 7: Follow up while the lead is warm
Conversion does not end at the form. A lead that waits two days for a reply is often talking to a competitor by then. Research published in the Harvard Business Review found that companies that responded to web leads within an hour were far more likely to qualify them than companies that waited longer (Oldroyd, McElheran and Elkington, 2011; not peer reviewed).
Set up an instant confirmation email that says who will reply and when, a calendar link for those who want to book straight away, and an alert to whoever handles new leads. This is often the fastest gain on the list, and it involves no design work at all.
A B2B conversion rate optimization checklist
Use this as a quick pass over your key pages:
Can a stranger say what you sell and who it is for after five seconds on the page?
Does each ad or email land on a page that repeats its promise?
Is there proof beside every major claim, with names and numbers?
Does the booking button say exactly what happens next?
Does the form ask only what you need to reply well?
Is there a lighter next step for visitors who are not ready to talk?
Does every key page load in under 2.5 seconds on a phone?
Are leads tagged in your CRM by source, so you can see which ones close?
Does every new lead get a reply within an hour?
What this looks like on real projects
Two examples from my own work:
Y Scouts, an executive search firm, needed its lead capture to feed its sales system. I wired four lead-capture pages from WordPress to HubSpot, including a book funnel that now converts 17.7% of its visitors into leads. See the Y Scouts project.
Snappy Kraken, a B2B software company serving financial advisors, moved from approved designs to live pages on HubSpot CMS in three weeks, because the message, proof and structure were agreed before anyone built anything. See the Snappy Kraken project.

The real HubSpot report for the Y Scouts book funnel, all time.
In both cases the gains came from clarity, proof and a working path to the sales team, not from testing button colours.

The real Snappy Kraken homepage, shown in an illustrative scene.
When should you hire B2B conversion rate optimization services?
B2B conversion rate optimization services are paid work to raise qualified leads and won deals from the traffic you already have, covering the audit, the fixes and the measurement. You should hire them when the leaks are clear but the fixes need design and build work, when your team cannot edit the site, or when the problems run deeper than any single page.
When the problems run deeper than any single page, be honest about it. If the offer, the structure and the proof all need work, more tweaks will not save the site, and the signs you need a website redesign and the B2B website redesign playbook cover that decision.
What do B2B conversion rate optimization services include?
A useful B2B CRO engagement has four parts: an audit tied to your CRM, a fix list ranked by likely revenue, design and build of those fixes, and measurement of qualified leads over a full sales cycle. Anything less is advice, not optimization.
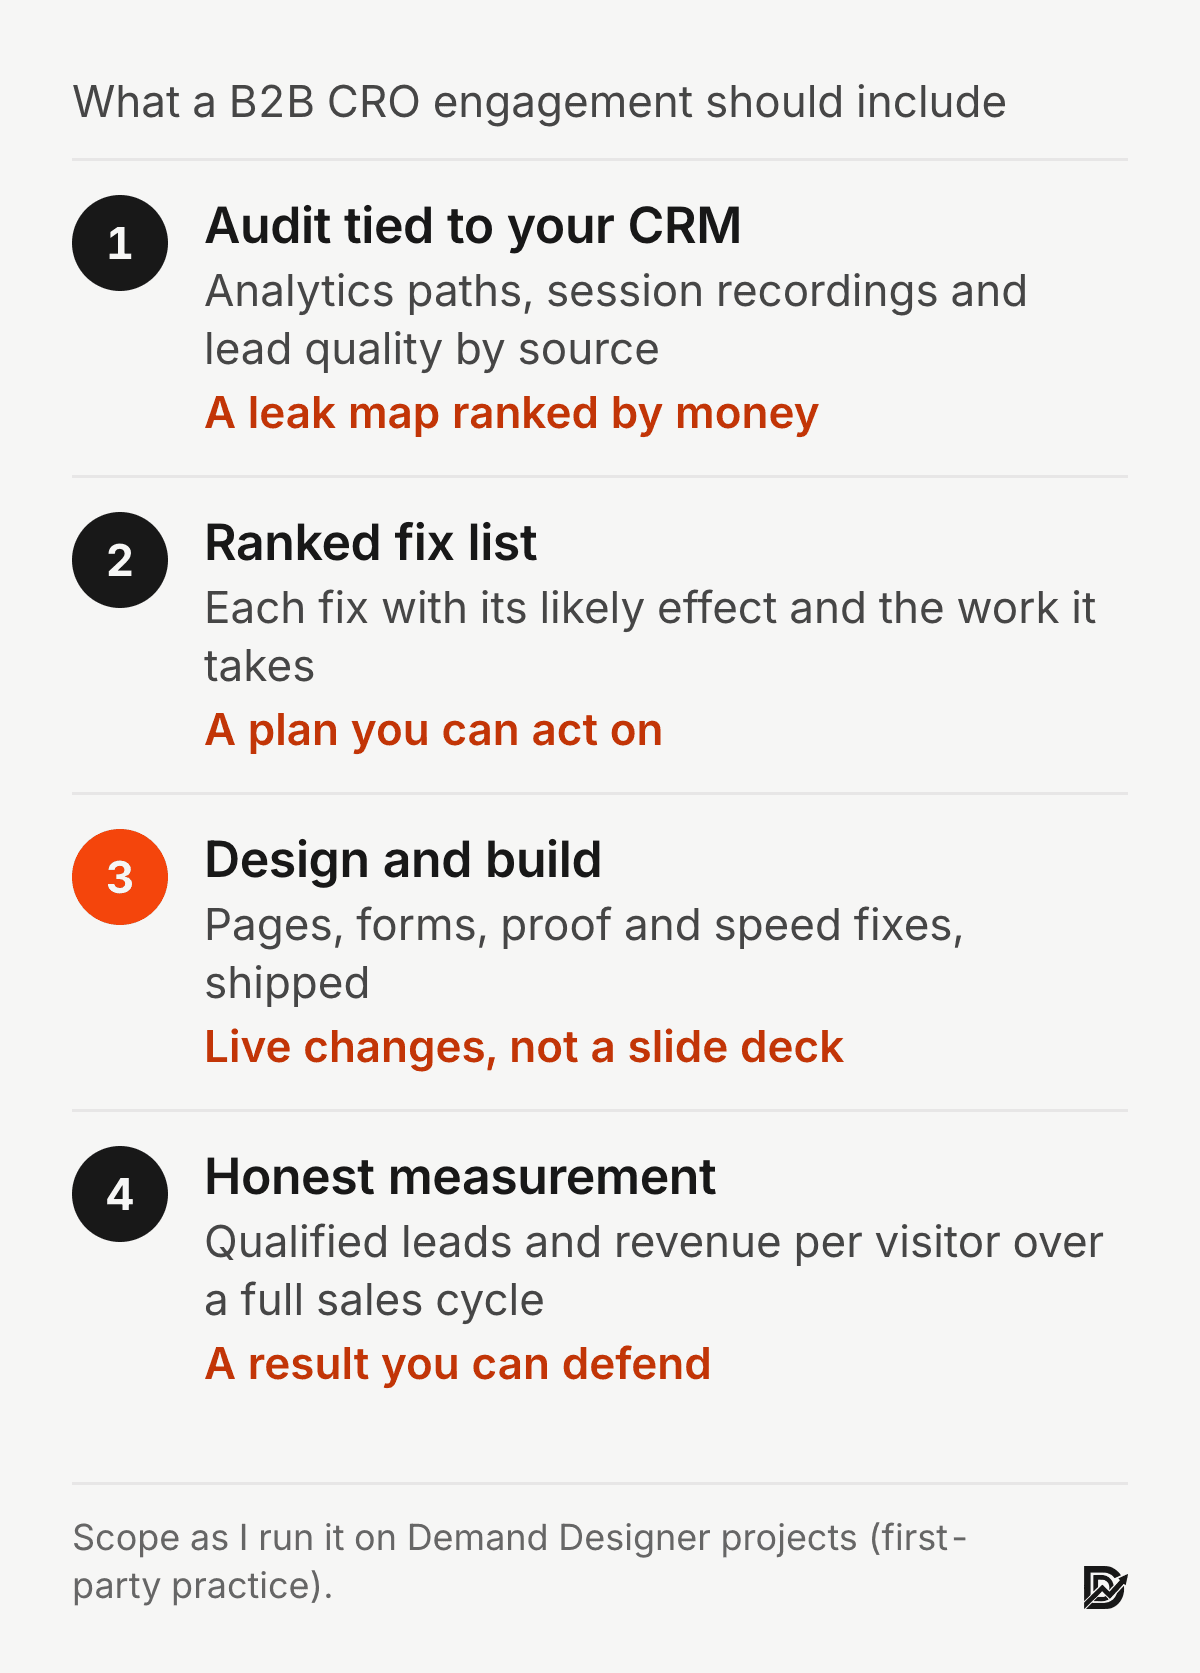
Audit tied to your CRM. Analytics shows where people leave. Session recordings show what confused them. The CRM shows which sources and pages produce leads that close. An audit that stops at page analytics ranks leaks by size, not by money.
Ranked fix list. A ranked fix list gives every fix its likely effect and the work it takes, so you can see why the pricing page comes before the blog template.
Design and build. New first screens, proof placed beside claims, shorter forms, faster pages. Shipped on your site, not left in a slide deck.
Honest measurement. Qualified leads and revenue per visitor, compared over a full sales cycle and split by traffic source, with a testing plan sized to your traffic.
On my Demand Designer projects the audit starts with the same 12 questions as the Pipeline Leak Scorecard, then goes into the analytics and the CRM. For Y Scouts, an executive search firm, that work ended with four lead-capture pages wired from WordPress into HubSpot, so every lead arrived tagged by source.
How much do B2B conversion rate optimization services cost?
US agencies quote roughly $5,000 to $20,000 for a one-time CRO audit, $2,500 to $10,000 a month for a retainer at small and mid-sized firms, and $15,000 to $25,000 or more a month for enterprise programs, according to Clicksgeek's April 2026 pricing guide.
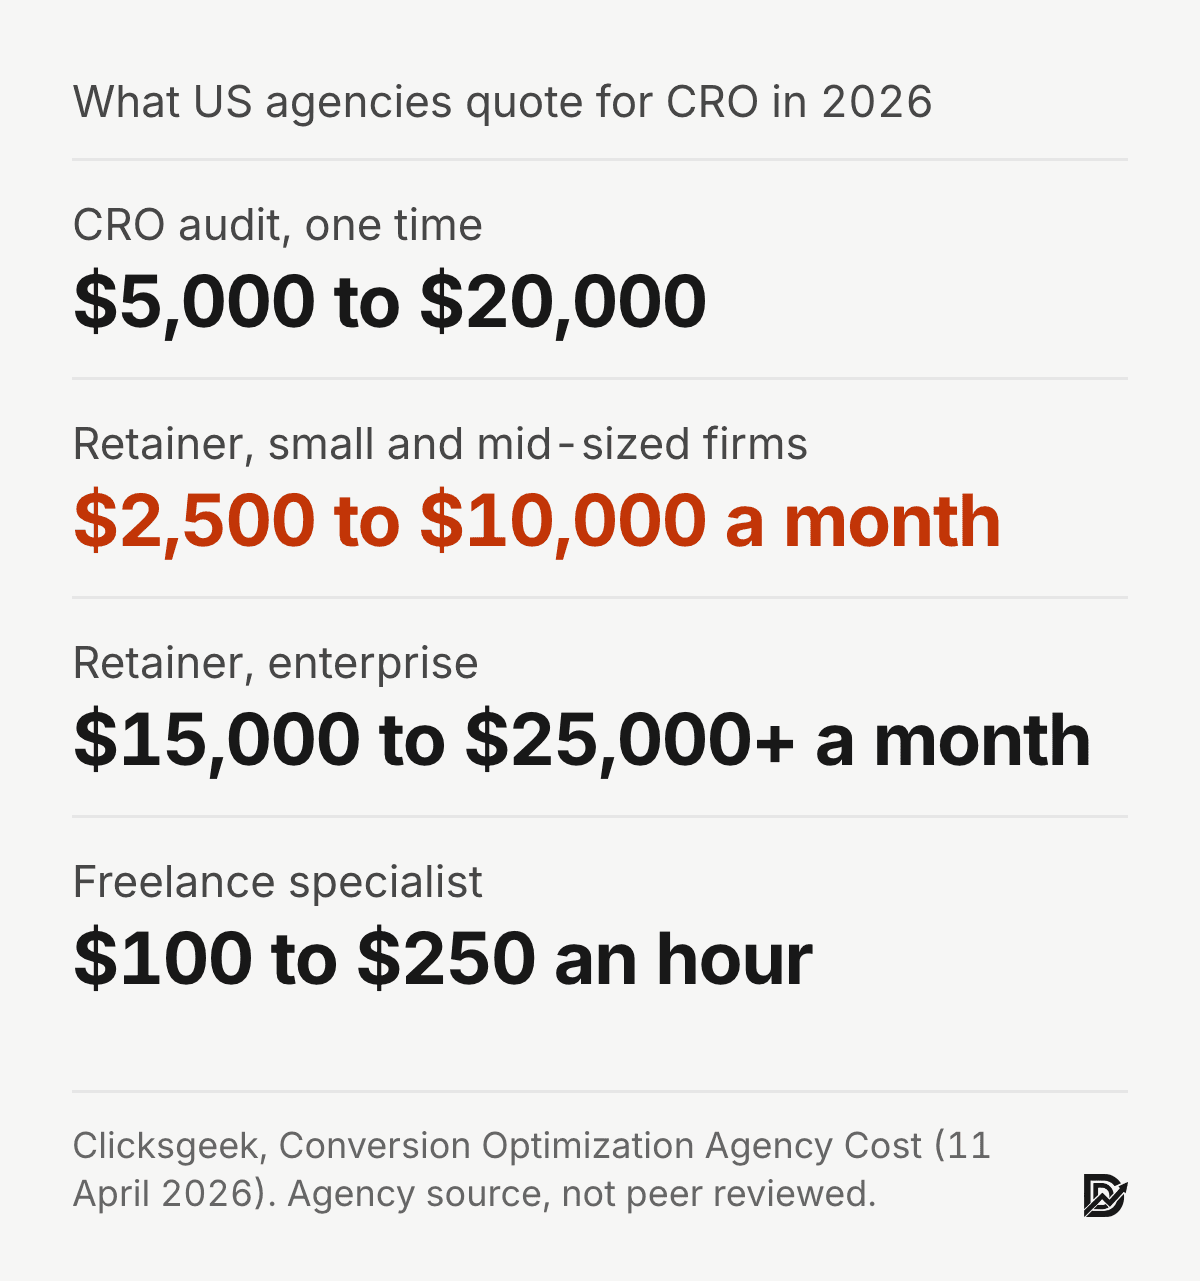
Those figures come from Clicksgeek (11 April 2026), an agency with an interest in the answer, so read them as a market range rather than a benchmark. The same guide puts experienced freelance CRO specialists at $100 to $250 an hour.
A testing retainer is the wrong shape for most B2B service firms. If your site gets a few thousand visits a month, the arithmetic in Step 6 means a retainer spends months waiting for tests to finish. The money goes further on an audit and a set of fixes that need no test to justify them.
I sell fixed-price builds, so weigh my view with that in mind. At Demand Designer, the Pipeline Leak Scorecard is free and finds the leaks. When the fixes need design and build work, I quote them as a fixed-price project; my build tiers are $3,250, $4,850, $6,950, $9,750 and $14,999 (USD), and the pricing page shows what each one covers.
What is high-ticket conversion optimization for B2B companies?
High-ticket B2B conversion optimization is CRO for firms whose deals are large and rare, such as a consultancy with a $25,000 average engagement, so each lead is worth thousands of dollars. The goal shifts from more form fills to more qualified conversations, and the page has to persuade a buying group, not one person.
Research on industrial buying groups has shown this for decades. Johnston and Bonoma (1981), Journal of Marketing studied purchases of capital equipment and industrial services in 31 firms and found that who takes part in a purchase, and how they interact, changes with the kind of purchase and the structure of the buying firm. On a high-ticket page that means proof for each person in the room: the operator who will use the work, the finance lead who signs, the executive who carries the risk.
Trust shaped repeat buying, not the first supplier choice. In a study of more than 200 purchasing managers, Doney and Cannon (1997), Journal of Marketing found that trust in the supplier firm, and in its salesperson through that firm, shaped whether buyers expected to keep working with a supplier.
After controlling for past experience and supplier performance, trust did not decide the current supplier choice. For a high-ticket site, I read that as two jobs: show performance evidence to win the first deal, and build trust for the relationship that follows.
Lead with the size of the problem you solve, not the list of services.
Put a named result, with the client and the timeframe, beside every claim a finance lead would question.
Answer price range, contract length and who does the work before the booking button.
Offer a lighter next step, such as a scorecard or a short guide, for the reviewers who are not ready to talk.
Should you hire a CRO agency, a freelancer or keep it in-house?
Keep CRO in-house when someone on your team owns the site and the CRM and has a few hours a week. Hire a freelancer or small studio when the fixes need design and build. Hire an agency when you have the traffic for a real testing program: at a 3% conversion rate, detecting a 20% lift takes about 26,000 visitors across both versions (see Step 6).
My rule of thumb: for B2B service firms with fewer than 10,000 visits a month, a freelancer or small studio fits best, one person who can audit, design and ship. A large agency testing program is built for sites with the traffic to feed it.
How do you choose a B2B conversion rate optimization provider?
Choose a provider who asks for your CRM data before promising anything, sizes the testing plan to your traffic, ships the fixes themselves, and reports on qualified leads rather than raw conversion rate.
The statistics are the quickest filter. Kohavi, Longbotham, Sommerfield and Henne (2009), Data Mining and Knowledge Discovery describe statistical power and sample size as areas critical to experimentation, and Johari, Koomen, Pekelis and Walsh (2017) showed that checking results repeatedly and stopping when a version looks ahead inflates false winners. A provider who declares a winner after a week on a site with 2,000 monthly visits is likely reporting noise. Ask these five questions on the first call:
What data do you need from our CRM, and what will you do with it?
How many visitors does your testing plan assume, and what happens if we do not have them?
Who designs and builds the fixes, and how fast do they go live?
What will you report: conversion rate, qualified leads or revenue per visitor?
Can you show a past result with the client named and the timeframe stated?
Be wary of any provider that promises a conversion lift before seeing your data. If you want to start with the free version, the Pipeline Leak Scorecard takes about 15 minutes with your site open, and you can see my fixed prices on the pricing page.
Frequently asked questions
What is a good conversion rate for a B2B website?
There is no single good number. Vendor benchmarks for B2B sites usually sit in the low single digits, but they mix industries and count every form fill. Your own last 90 days, split by traffic source, is the baseline that matters. Aim to improve qualified leads per visitor against it.
How long does B2B conversion rate optimization take to show results?
Clear fixes, such as a broken form, a vague headline or slow follow-up, can lift leads within weeks. Proving an effect on revenue takes at least one full sales cycle, often two to three months for B2B services, because leads take time to close.
Can you A/B test with low traffic?
Yes, but only for big changes. Detecting a small lift needs tens of thousands of visitors per version. With a few thousand visitors a month, test bold changes such as a new offer, measure clicks to the booking page as an early signal, and fix obvious problems without testing.
What is the difference between CRO and landing page optimization?
Landing page optimization improves single pages, usually for paid traffic. Conversion rate optimization covers the whole path from first visit to signed client, including forms, follow-up speed and how leads are qualified in your CRM.
Should B2B forms ask qualifying questions?
Ask one, about the problem the buyer wants solved. It helps you reply well and filters poor fits without costing many leads. Move budget, timeline and company size questions to the call or to a short form after booking.
Sources
Peer-reviewed research
Doney, P. M. and Cannon, J. P. (1997). An examination of the nature of trust in buyer-seller relationships. Journal of Marketing, 61(2), 35 to 51. doi:10.1177/002224299706100203
Fogg, B. J., Soohoo, C., Danielson, D. R., Marable, L., Stanford, J. and Tauber, E. R. (2003). How do users evaluate the credibility of Web sites? Proceedings of the 2003 Conference on Designing for User Experiences. doi:10.1145/997078.997097
Galletta, D. F., Henry, R., McCoy, S. and Polak, P. (2004). Web site delays: How tolerant are users? Journal of the Association for Information Systems, 5(1). doi:10.17705/1jais.00044
Johari, R., Koomen, P., Pekelis, L. and Walsh, D. (2017). Peeking at A/B tests: Why it matters, and what to do about it. Proceedings of the 23rd ACM SIGKDD International Conference on Knowledge Discovery and Data Mining. doi:10.1145/3097983.3097992
Johnston, W. J. and Bonoma, T. V. (1981). The buying center: Structure and interaction patterns. Journal of Marketing, 45(3), 143 to 156. doi:10.1177/002224298104500312
Kohavi, R., Longbotham, R., Sommerfield, D. and Henne, R. M. (2009). Controlled experiments on the web: Survey and practical guide. Data Mining and Knowledge Discovery, 18(1), 140 to 181. doi:10.1007/s10618-008-0114-1
Reber, R., Schwarz, N. and Winkielman, P. (2004). Processing fluency and aesthetic pleasure: Is beauty in the perceiver's processing experience? Personality and Social Psychology Review, 8(4). doi:10.1207/s15327957pspr0804_3
Seckler, M., Heinz, S., Bargas-Avila, J. A., Opwis, K. and Tuch, A. N. (2014). Designing usable web forms: Empirical evaluation of web form improvement guidelines. Proceedings of the SIGCHI Conference on Human Factors in Computing Systems. doi:10.1145/2556288.2557265
Books, standards and industry data (not peer reviewed)
Kohavi, R., Tang, D. and Xu, Y. (2020). Trustworthy Online Controlled Experiments: A Practical Guide to A/B Testing. Cambridge University Press. doi:10.1017/9781108653985
Oldroyd, J. B., McElheran, K. and Elkington, D. (2011). The short life of online sales leads. Harvard Business Review, March 2011.
Google, Core Web Vitals thresholds for Largest Contentful Paint.
Iqbal, F. (11 April 2026). Conversion optimization agency cost. Clicksgeek. Agency pricing guide, not peer reviewed.
Y Scouts and Snappy Kraken results are first-party figures from my own client work.
Free workbook
Pipeline Leak Scorecard
Find the leaks between your traffic and your pipeline. Score your site in about fifteen minutes, with it open in front of you.
12 questions, 8 pages, 15 minutes. Free.