Web Design
7 Claims on How Many Form Fields: 2026 Field Guide

Joshua Jackai
15 min

Short answer: I found no published number backed by a primary study. The 4.1% per field, 67.8% and "3 to 5 fields" figures have no source I could trace, and the famous 11-to-4 test rests on 10 versus 26 submissions. In surveys and that one test, fewer fields raised completion. Their effect on sales-accepted leads is unmeasured.
Search for how many form fields a lead form should have and you get precise percentages: 4.1% per field, 67.8% abandonment, a 120% lift. I am Joshua Jackai, founder of Demand Designer, a US studio that builds B2B websites on Framer, HubSpot and WordPress. I went looking for the study behind each number, because a form that sales has to chase is an expensive thing to guess about. This guide checks seven claims, says what each one rests on, and ends with a test design you can run. It is a source audit, not a client result. Figures come from the sources linked in each section, read on 16 October 2026.
Key takeaways
The 4.1% per-field cost is credited to HubSpot (2024) in one B2B guide, with no link and no primary study found.
The 120% lift from cutting 11 fields to 4 came from 10 form submissions before and 26 after, in two different seasons, on one agency site.
Peer-reviewed work shows that longer questionnaires lose respondents, but it measures surveys, not B2B lead forms.
No dataset I found ties form length to sales-accepted leads, which is the number that pays for the form.
Detecting a 5-point change in sales-accepted rate needs roughly 1,100 leads per version at a 20% baseline.
# | Claim | Where it comes from | What I found |
|---|---|---|---|
1 | Each extra field costs 4.1% | A May 2025 B2B guide, crediting HubSpot 2024 | No primary study found |
2 | 11 fields to 4 lifts conversion 120% | Imaginary Landscape case study, 2008 | Real test, 10 versus 26 submissions |
3 | Past 7 fields, 67.8% abandon | The same guide, crediting Formstack 2025 | Report not located |
4 | 3 to 5 fields is the best number | The same guide, crediting Forrester 2024 | No document found |
5 | Longer forms bring better leads | Scoring statistics, not form length | Never measured |
6 | Phone number costs 18.7% | Ratings by 500 sales leaders, per the guide | Opinion, not measurement |
7 | Test it yourself | Controlled experiments | About 1,100 leads per version |
1. Does every extra form field cost 4.1% of conversions?
The claim that each extra form field cuts conversions by 4.1% has no primary study I could find. A May 2025 B2B guide from Brixon Group credits it to HubSpot in 2024 without a link, and HubSpot's own post on 40,000 landing pages says conversion falls slightly as fields rise, with no per-field percentage in the text.
Claim: about 4.1% fewer conversions per added field
Credited to: HubSpot, 2024, in one guide with no link
What I found at HubSpot: a post on more than 40,000 landing pages, updated June 2025
What that post says in words: the drop is smaller than the author expected, and text areas and drop-downs hurt most
Verdict: untraced
The useful detail sits in the HubSpot post, not in the 4.1%. Its author expected a steep fall as fields were added and reported a shallower one. The post also splits field types: a single-line text field adds little friction, while several text areas or drop-downs hurt conversion more. That matters for a B2B form, because sales teams often ask for open text, such as "tell us about your project", and that is a text area. A flat per-field percentage hides that difference. The same Brixon guide also lists a 30% conversion penalty for forms past five fields, credited to MarketingSherpa in 2024, again with no link. I treat all of these as leads to check, not as facts to quote in a board deck.
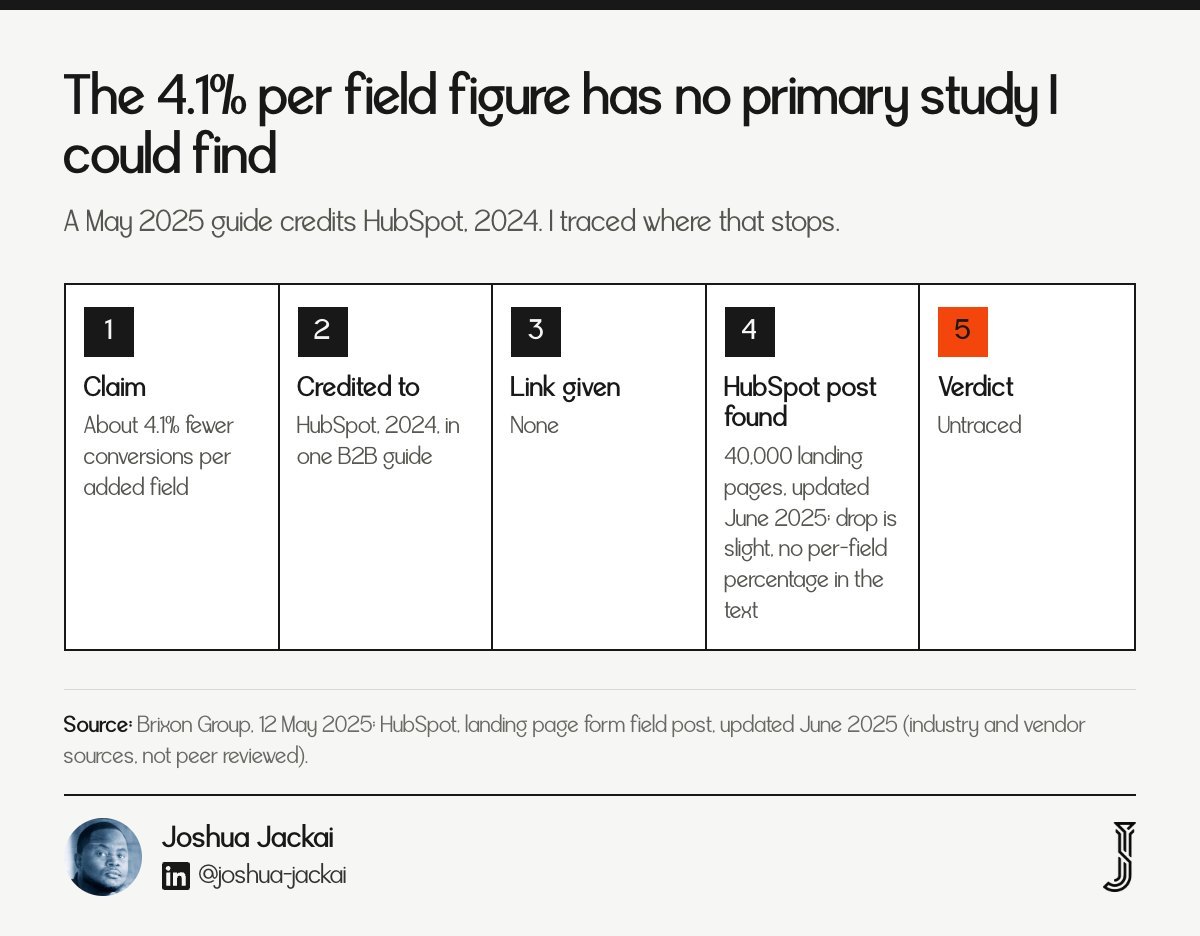
According to HubSpot's analysis of more than 40,000 landing pages, conversion falls slightly as the number of fields rises (vendor source, post updated June 2025, not peer reviewed).
2. Did cutting 11 fields to 4 really lift conversion by 120%?
Imaginary Landscape's 2008 test of 11 versus 4 form fields is real, but its sample is tiny. The agency reported conversion rising from 5.4% to 11.9% on its own site, which is 10 submissions in the first period and 26 in the second.
Who ran it: Imaginary Landscape, a Chicago web agency, on its own site
Design: before and after, not a concurrent split test
Periods: October to November 2007, then April to May 2008
Counts: 10 of 184 form views, then 26 of 219
My calculation: Fisher exact test p = 0.034; 95% intervals of 3.0% to 9.7% and 8.2% to 16.8%
The agency reported the result in a 2008 case study, and it still circulates as "11 to 4 fields, 120% more conversions". Three things limit what it proves. The two forms ran in different seasons, so traffic mix could differ. The sample is 36 submissions in total, which makes the percentage swing wide. And the case study judged lead quality by reading the submissions and found "a consistent quality", without counting qualified leads. The direction is plausible and my test says the gap is unlikely to be chance alone, but the 120% is not a number to forecast with. Read it as one small agency finding that points the same way as the survey research. If your own form asks for a fax number, a street address or a "how did you hear about us" menu that sales never reads, the case for deleting those fields needs no percentage at all.

"Removing all but the most essential fields increased conversions without compromising the quality of those conversions.", Imaginary Landscape wrote in its 2008 case study
The Imaginary Landscape case study reports 5.4% conversion on 11 fields and 11.9% on 4, from 10 and 26 thank-you page views (industry source, June 2008, not peer reviewed).
3. Do forms past 7 fields lose 67.8% of visitors?
The report behind the 67.8% abandonment figure is missing: I could not find it. The Brixon guide credits a Formstack study of 1,500 B2B decision makers in 2025 with a 67.8% abandonment rate for forms over 7 fields. The guide links nothing, and my searches found the figure only in secondary posts.
Claim: 67.8% average abandonment past 7 fields
Credited to: Formstack, 2025, 1,500 B2B decision makers
Link given: none
Primary report located: no
Verdict: treat as unverified
Abandonment is also a loose word. It can mean a visitor who started the form and quit, or any visitor who saw the page and left. Without the report I cannot tell whether 67.8% describes long forms or forms in general. A rate for forms in general would say nothing about the cost of the eighth field, and a rate for long forms alone would need a short-form comparison from the same study before it could be read as a penalty. What peer review does support is the direction. In an experiment on stated questionnaire length, Galesic and Bosnjak (2009) found that longer announced length meant fewer people started and finished, and Liu and Wronski (2017) found the same negative link between length and completion across 25,080 real surveys. Both measure surveys. Neither gives a per-field cost for a demo request.

"As expected, the longer the stated length, the fewer respondents started and completed the questionnaire.", Galesic and Bosnjak of the Max Planck Society and the Free University of Bozen-Bolzano wrote in Public Opinion Quarterly (2009)
Liu and Wronski analysed 25,080 web surveys from one online panel and report a negative relationship between survey length and completion rate (Social Science Computer Review, 2017, peer reviewed).
4. Is 3 to 5 fields the best number for a B2B form?
The claim that 3 to 5 fields is best for B2B has no document behind it that I could find. The Brixon guide credits Forrester Research in 2024 and links nothing, and the one peer-reviewed form study I found tested a bundle of 20 usability guidelines, not field count alone. The range may be sensible; it is not established.
Claim: 3 to 5 fields is best for B2B
Credited to: Forrester Research, 2024, no link
Closest peer-reviewed study: Seckler and colleagues, CHI 2014, N = 65
What that study changed: 20 guidelines at once, on forms from real company websites
Verdict: a convention, not a finding
Seckler, Heinz, Bargas-Avila, Opwis and Tuch ran an eye-tracking experiment on forms taken from real company sites and applied 20 guidelines to them. The improved forms were completed faster, with fewer submission attempts and fewer eye movements. That is good evidence that form design matters. It does not say that four fields beat six, because layout, labels, error messages and field order changed together. When someone quotes a best field count, ask which of those other variables they held still. I would start a B2B demo request with name, work email and one open question, because every field beyond those needs a reason that sales can state. That is my starting point for a test, not a result. If a vendor tells you four fields is the answer, ask whether their forms were tested against sales acceptance or only against submissions.

"improved web forms lead to faster completion times, fewer form submission trials, and fewer eye movements", Seckler, Heinz, Bargas-Avila, Opwis and Tuch of the University of Basel wrote in the CHI 2014 proceedings
Seckler and colleagues (2014) tested 20 guidelines together on forms from real company websites with 65 participants (ACM CHI, peer reviewed).
5. Do longer forms bring better leads?
I found no dataset showing that longer forms bring better leads, or that they bring worse ones. The claim usually rests on lead-scoring statistics that describe how much data a scoring model has, not how long the form was. I found no dataset that counts sales-accepted leads by field count.
Claim: more fields mean higher-quality leads
Closest figure: "35% higher sales acceptance with data-rich scoring", credited to Marketo 2024 in the Brixon guide
What that figure measures: scoring inputs, not form length
Imaginary Landscape on quality: read by hand, called consistent, no counts
Verdict: unmeasured
This is the gap that matters. Everything else in this guide is about getting more people to submit. A head of marketing is paid for leads that sales accepts, and a longer form could filter out weak interest, or could filter out busy buyers who would have closed. Both stories are plausible, so neither deserves a percentage. Until someone publishes counts, a claim that longer forms bring better leads is a hypothesis you can test, and a claim that shorter forms never hurt quality is the same. Self-selection works in both directions: friction removes the casual and the pressed alike. The honest summary is that completion rate is cheap to measure, which is why every public number is about completion, while sales acceptance takes weeks of CRM data, which may be why I found no one publishing it.
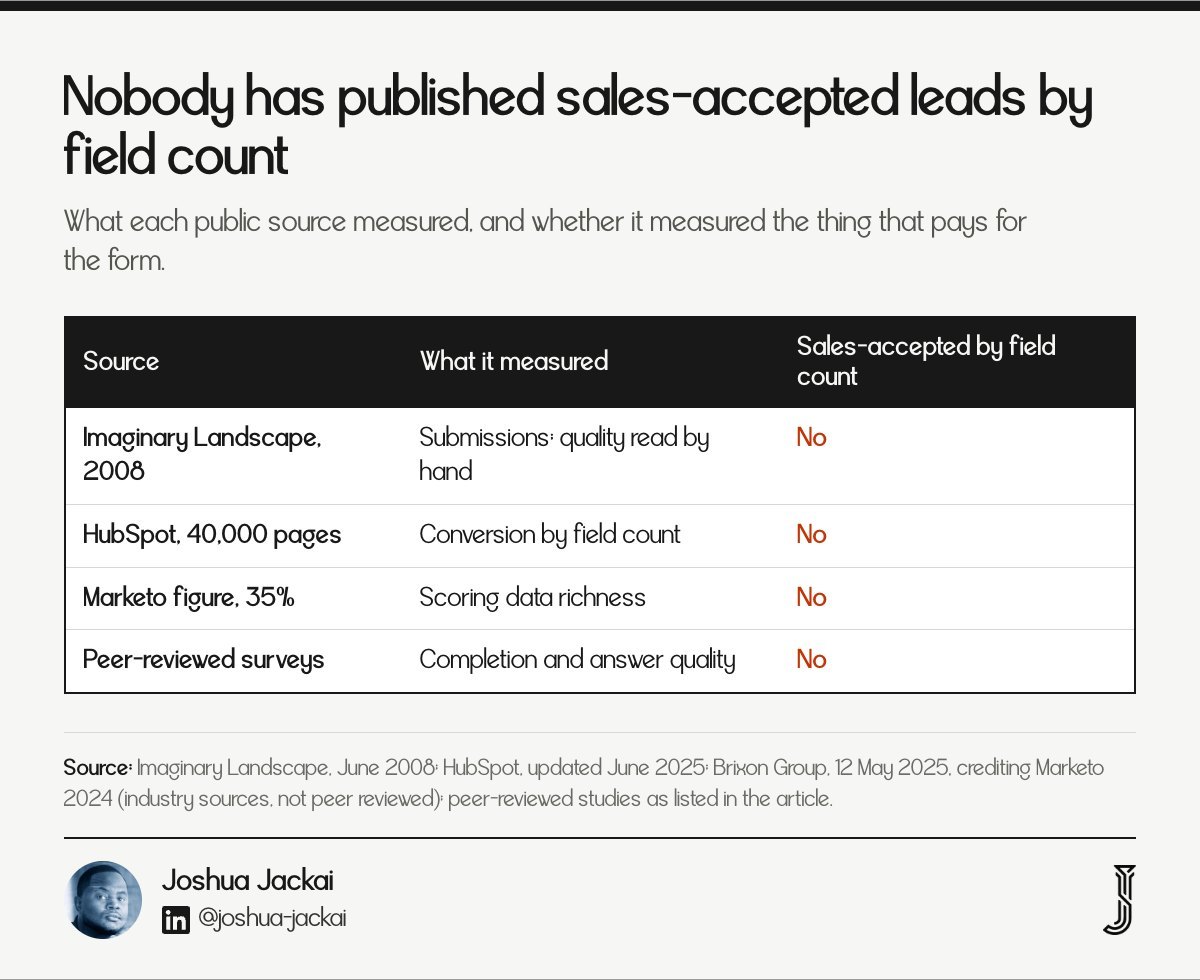
"A form is a filter, and the only way to know what it filters is to count the leads sales accepts.", Joshua Jackai, founder of Demand Designer
The Brixon guide's 35% sales-acceptance figure is credited to Marketo in 2024 and concerns lead scoring data, not form length (industry source, May 2025, not peer reviewed).
6. Which single field costs the most conversions?
The Brixon Group guide ranks a phone number as the costliest field, at 18.7% of conversions, but the figure comes from ratings by 500 sales leaders, not measured submissions. It puts an email address at 1.2%. I found no log of real submissions behind either number.
Claimed cost of a phone number: 18.7% of conversions
Claimed cost of a budget field: 15.3%
Claimed cost of a job title: 7.2%
Claimed cost of an email address: 1.2%
Basis, as the guide describes it: sales leaders rating relevance and impact, 2025
Verdict: a ranking of opinions

The ordering is believable. People hesitate over phone numbers and budgets more than over a work email. What I distrust is the precision. If sales leaders estimated these costs, the decimals are false resolution. Research on disclosure explains why a fixed percentage per field cannot hold. In four experiments, John, Acquisti and Loewenstein (2011) found that people reveal or withhold private information in response to environmental cues that bear little relation to the real risk. Their experiments covered sensitive survey questions, not form fields, but they suggest a phone number may cost less on a page that feels trustworthy than on a cold one. The cost of a field depends on the page around it, which means a ranking from one site does not transfer to yours. The practical use of the table is as a list of fields to question, not as a forecast.
"disclosure of private information is responsive to environmental cues that bear little connection, or are even inversely related, to objective hazards", John, Acquisti and Loewenstein wrote in the Journal of Consumer Research (2011)
In four experiments, John, Acquisti and Loewenstein (2011) showed that willingness to disclose depends on context cues rather than on the real hazard (Journal of Consumer Research, peer reviewed).
7. How do you test form length against sales-accepted leads?
Run a concurrent split test and count sales-accepted leads, not submissions. At a 20% baseline, spotting a rise to 25% needs about 1,094 leads per version at 5% significance and 80% power, so low-volume B2B forms can only test big changes.
Split: randomise visitors between two forms on the same page at the same time
Primary metric: sales-accepted leads per 100 visitors, read 60 to 90 days later
Guard metrics: form completion rate, and median days to first sales touch
Sample size (my calculation): 686 per version for 10% to 15%; 1,094 for 20% to 25%; 1,376 for 30% to 35%
Avoid: before-and-after comparisons across seasons, which is what the 11-to-4 test did
Kohavi, Longbotham, Sommerfield and Henne (2009) describe controlled experiments as the best design for establishing cause and effect on the web, and they stress statistical power and sample size. The practical consequence for a B2B form is arithmetic. If your form brings 40 leads a month, a test for a 5-point difference in sales acceptance would take years. In that case, remove the fields that are plainly extraneous, such as a fax number or a second address line, and spend the testing effort where volume allows, for instance on the offer or the page copy. If you have thousands of leads, test the middle: the job title, the company size, the phone number. Record which fields sales actually used in the first call. A field that no one reads is a cost with no return.

"Controlled experiments embody the best scientific design for establishing a causal relationship between changes and their influence on user-observable behavior.", Kohavi, Longbotham, Sommerfield and Henne of Microsoft wrote in Data Mining and Knowledge Discovery (2009)
The sample sizes here come from the standard two-proportion formula with a two-sided 5% significance level and 80% power; they are my calculation.
How do the seven form field claims compare?
Two of the seven rows have a primary source: the 11-to-4 test and the survey-length research. The matrix lists the six claims checked in this guide plus the survey-length finding, with four attributes each: primary source, sample size, lead-quality measure and verdict.
Claim | Primary source found | Sample size known | Measures lead quality | Verdict |
|---|---|---|---|---|
4.1% per field | No | No | No | Untraced |
11 to 4 fields, 120% | Yes | 36 submissions | By hand, no counts | Real but small |
67.8% past 7 fields | No | Claimed 1,500 | No | Unverified |
3 to 5 fields best | No | No | No | Convention |
Longer forms, better leads | No | No | No | Unmeasured |
Phone number costs 18.7% | No | Claimed 500 raters | No | Opinion |
Survey length lowers completion | Yes | 25,080 surveys | No | Supported for surveys |
How many leads do you need to test your form?
Detecting a 5-point lift in sales-accepted rate needs 686 to 1,376 leads per version at baselines of 10% to 30%, at a two-sided 5% significance level and 80% power. The table lists four common cases. The constants are standard; the rates are placeholders to replace with your own.
Sales-accepted rate now | Rate you want to detect | Leads per version | Leads in total |
|---|---|---|---|
10% | 15% | 686 | 1,372 |
20% | 25% | 1,094 | 2,188 |
25% | 30% | 1,251 | 2,502 |
30% | 35% | 1,376 | 2,752 |
How do you check a form statistic before you quote it?
Ask five questions before a form statistic goes into a deck: who measured it, how many people were in it, was it a concurrent test, what did it count, and can you open the original. A figure that fails two of the five is a lead to check, not a fact.
"A figure that fails two of the five is a lead to check, not a fact.", Joshua Jackai, founder of Demand Designer
Who measured it? A named study with a link beats "research shows". The 4.1% and 67.8% figures name an organisation and a year, but no document.
How many people were in it? The 11-to-4 test had 36 submissions in total. A percentage with a count under 100 behind it swings widely, which is why I give the intervals.
Was it a concurrent test? Before-and-after comparisons across seasons mix the form with everything else that changed. A split test shows both versions to similar visitors at the same time.
What did it count? Completion, submissions and sales-accepted leads are three different numbers. Almost every public figure is the first or second.
Can you open the original? If the only copy sits in other blogs repeating each other, the number may have started as one blog's estimate. Citation chains in marketing posts are short and circular more often than they look.
I would apply the same five questions to this guide. Every number here links to its source or says it is my calculation, and where I could not find the source I say so instead of rounding the claim into something that sounds firmer. If you find the Formstack, Forrester or MarketingSherpa documents behind the figures I could not trace, send them to me and I will update the relevant section and the date on this page.
Frequently asked questions
How many form fields should a B2B lead form have?
There is no proven number. Peer-reviewed work shows shorter questionnaires keep more respondents, and an agency test saw conversion rise when it cut 11 fields to 4. I would start with name, work email and one open question, then add a field only when sales will use it.
Do fewer form fields lower lead quality?
No dataset I found shows that. The only public evidence is an agency reading its own submissions and calling quality consistent after cutting fields, without counts. To know for your business, split-test the forms and compare sales-accepted leads per 100 visitors after 60 to 90 days.
Where does the 4.1% per field statistic come from?
The 4.1% per-field statistic has no primary study that I could find. A May 2025 Brixon Group guide credits HubSpot in 2024 and links nothing. HubSpot's post on 40,000 landing pages says conversion falls slightly as fields rise, with no per-field percentage in its text.
How long should I run a form length test?
Run it until each version has the sample size you calculated, and long enough to cover full sales cycles in your reporting window. For most B2B forms that means counting leads, not days. Read sales-accepted results 60 to 90 days after the last lead arrives, so late acceptances are counted.
How I set this up for B2B teams
I build B2B marketing sites on Framer and HubSpot at fixed prices from $3,250 to $14,999. When a client says leads are poor, I start at the form: which fields sales reads, which nobody opens, and whether each lead keeps its source in the CRM. The Pipeline Leak Scorecard walks through that check in about fifteen minutes and is free.
Sources
Peer reviewed
Galesic, M. and Bosnjak, M. (2009). Effects of questionnaire length on participation and indicators of response quality in a web survey. Public Opinion Quarterly. doi.org/10.1093/poq/nfp031
Liu, M. and Wronski, L. (2017). Examining completion rates in web surveys via over 25,000 real-world surveys. Social Science Computer Review. doi.org/10.1177/0894439317695581
Seckler, M., Heinz, S., Bargas-Avila, J. A., Opwis, K. and Tuch, A. N. (2014). Designing usable web forms: empirical evaluation of web form improvement guidelines. Proceedings of the SIGCHI Conference on Human Factors in Computing Systems. doi.org/10.1145/2556288.2557265
Kohavi, R., Longbotham, R., Sommerfield, D. and Henne, R. M. (2009). Controlled experiments on the web: survey and practical guide. Data Mining and Knowledge Discovery. doi.org/10.1007/s10618-008-0114-1
John, L. K., Acquisti, A. and Loewenstein, G. (2011). Strangers on a plane: context-dependent willingness to divulge sensitive information. Journal of Consumer Research. doi.org/10.1086/656423
Industry and vendor
Moloney, B. (2008). Fewer fields in a contact form sharply increases conversions. Imaginary Landscape case study, June 2008. imagescape.com case study PDF. Industry source, not peer reviewed.
HubSpot. Which types of form fields lower landing page conversions, page updated June 2025. blog.hubspot.com. Vendor source, not peer reviewed.
Brixon Group. Lead forms in B2B: the perfect balancing act between data depth and conversion rate, 12 May 2025. brixongroup.com. Secondary source quoted for the claims checked; none of its statistics link to a primary study.
Sample sizes and the Fisher exact test in items 2 and 7 are my own calculations from the figures stated, using the standard two-proportion formula. Build prices are Demand Designer's fixed-price tiers, October 2026. First-party.
Free workbook
Pipeline Leak Scorecard
Find the leaks between your traffic and your pipeline. Score your site in about fifteen minutes, with it open in front of you.
12 questions, 8 pages, 15 minutes. Free.