Web Design
8 Checks to Answer: Is Elementor Bad for SEO?

Joshua Jackai
18 min

Published 7 November 2026 · Last updated and fact-checked November 2026
Short answer: Elementor does not hurt SEO by itself, but Elementor sites pass Google's Core Web Vitals less often. In September 2026, 55.6% of 86,228 US Elementor sites passed on mobile, against 62.0% for all WordPress and 68.4% for Bricks (HTTP Archive, 2026). The weak metric is load speed, which is often fixable without a rebuild.
Key takeaways
Across 86,228 US Elementor origins, 55.6% passed all three Core Web Vitals on mobile in September 2026, 6.4 points below WordPress as a whole (HTTP Archive, 2026).
The weak metric is Largest Contentful Paint: 61.6% of US Elementor sites were good on mobile, while 94.4% were good on Interaction to Next Paint (HTTP Archive, 2026).
Google says Core Web Vitals "are used by our ranking systems" but that it shows the most relevant content "even if the page experience is sub-par" (Google Search Central).
Elementor sites improved from 52.2% to 55.6% passing in a year, so the gap is closing, slowly (HTTP Archive, 2026).
A rebuild pays only when your own field data still fails after the fixes and a redesign is due anyway.
# | Check | What to look at | Number to know | Pass looks like |
|---|---|---|---|---|
1 | What does real-user data say? | Pass rates by builder | Elementor 55.6%, US mobile | You know the gap is about 6 to 13 points |
2 | Is the builder the cause? | Who builds with it, and where it is hosted | 86,228 US Elementor origins | You treat the data as correlation |
3 | Which metric fails? | LCP, INP and CLS separately | LCP good on 61.6% | You know it is load speed |
4 | How much does it weigh in ranking? | Google's own wording | No single signal | Content first, speed as a tiebreak |
5 | What does your own site show? | Field data at the 75th percentile | LCP under 2.5 seconds | Search Console groups pass |
6 | Which settings fix LCP first? | Elementor's performance tab | 4 stable settings to switch on | Field LCP passes in 28 days |
7 | How slow is too slow for buyers? | Peer-reviewed waiting studies | About 2 seconds tolerated | Your hero shows before buyers leave |
8 | When is a rebuild worth it? | Field result after fixes, redesign timing | Builds from $3,250 | Both conditions are true |
1. What does real-user data say about Elementor sites?
Real-user data says Elementor sites pass Core Web Vitals less often than WordPress sites overall. HTTP Archive reads Chrome's field data for every origin it can detect. In September 2026, 55.6% of 86,228 US Elementor origins passed all three metrics on mobile. WordPress as a whole passed at 62.0%, and Bricks at 68.4%.
Data source: HTTP Archive technology report, built on the Chrome UX Report
Month: September 2026, the latest published when I pulled it on 7 November 2026
Region: United States of America, mobile and desktop read separately
Pass means: good LCP, INP and CLS at the 75th percentile of real visits
Elementor desktop: 60.4% of 79,264 US origins passed
"Core Web Vitals are used by our ranking systems," stated Google Search Central's page experience guide.
The page one results I read on 7 November 2026 argued from one site's PageSpeed score, a plugin vendor's test or a forum post. None used field data by builder, which is the kind of data Search Console reports. So I pulled it. The table under this section is the US mobile result for every builder and platform HTTP Archive returned.
Two things stand out. Elementor sits at the bottom of the WordPress builders, level with Divi at 56.6%. And the hosted platforms sit far above all of them: Webflow at 80.2%, Squarespace at 82.9%, Shopify at 85.5% and Wix at 88.7% (HTTP Archive, 2026). That second gap is bigger than any gap between WordPress builders, which tells you hosting and defaults matter at least as much as the builder. Framer returned no rows, so I cannot place the platform I build on. The global figures are lower across the board, with Elementor at 36.3% of 877,513 origins on mobile (HTTP Archive, 2026), because global traffic includes slower networks and devices.
Builder or platform | US mobile pass rate | US origins tested |
|---|---|---|
Elementor | 55.6% | 86,228 |
Divi | 56.6% | 29,242 |
Oxygen | 60.9% | 1,796 |
WordPress (all) | 62.0% | 352,468 |
Gutenberg plugin | 64.6% | 3,964 |
Beaver Builder | 67.7% | 12,301 |
GenerateBlocks | 68.1% | 2,697 |
Bricks | 68.4% | 1,925 |
Webflow | 80.2% | 16,374 |
Squarespace | 82.9% | 43,207 |
Shopify | 85.5% | 118,969 |
Wix | 88.7% | 37,229 |

2. Is Elementor the cause, or is it who builds with it?
The data cannot say, because it shows correlation, not cause. Elementor is popular with beginners and on low-cost hosting, which may lower scores, while Bricks and GenerateBlocks users may skew toward developers. The 12.8 point gap between Elementor and Bricks (HTTP Archive, 2026) mixes builder code with builder audience.
Elementor's share of US WordPress origins tested: about 24.5%, 86,228 of 352,468
Bricks sample: 1,925 US origins, small enough to move a few points month to month
Not controlled for: hosting, theme, plugin count, image weight, page type
Test that would settle it: the same site, same host, built twice
What I found: no published test of that kind
"There is no single signal," Google wrote of page experience in its Search Central documentation.
Think about who picks each tool. A marketing manager who needs a site live in two weeks on a $10 a month host often reaches for Elementor and a theme with a slider in the hero. A developer who already knows what a render-blocking script is often reaches for Bricks or GenerateBlocks. Both groups then pass or fail for reasons the builder did not cause.
The hosted platforms make the same point from the other side. Wix owners are often non-technical too, yet 88.7% pass on US mobile (HTTP Archive, 2026). The difference is that Wix controls the hosting, the image pipeline and the code every site ships. On WordPress, all three are your problem.
So I read the gap as a warning about defaults, not a verdict on the plugin. An Elementor site on good hosting with light images can pass. A Bricks site with a 4 MB hero video can fail. What the data does tell you is that the typical Elementor site needs more work to pass than the typical site on most alternatives, and you should budget for that work.

3. Which Core Web Vital do Elementor sites fail?
Elementor sites mostly fail on loading, not on interaction or layout shift. On US mobile, 61.6% had a good Largest Contentful Paint, while 94.4% had a good Interaction to Next Paint and 90.2% a good Cumulative Layout Shift. Against WordPress overall, Elementor trails only on LCP, by 8.8 points, and leads on the other two.
LCP, good on US mobile: Elementor 61.6%, WordPress 70.4%, Bricks 72.5%, Webflow 86.4%
INP, good on US mobile: Elementor 94.4%, WordPress 92.6%, Bricks 95.9%
CLS, good on US mobile: Elementor 90.2%, WordPress 88.1%, Bricks 95.8%
Good LCP threshold: 2.5 seconds or less at the 75th percentile
Takeaway: the problem is the first big paint, not clicks or jumps
"The tolerable waiting time for information retrieval is approximately 2 s," wrote Fiona Nah in Behaviour and Information Technology, 2004, a target that sits close to Google's 2.5 second LCP mark.
This is the most useful finding in the dataset, and it changes what you should fix. The forum complaint about Elementor is usually "bloat": too many nested div elements and too many scripts. Bloat would show up as poor INP, because heavy JavaScript slows responses to taps. It does not. Elementor sites score better on INP than WordPress as a whole, 94.4% against 92.6% (HTTP Archive, 2026).
LCP is where Elementor falls behind, 8.8 points below WordPress overall (HTTP Archive, 2026). LCP measures when the largest element in view, usually the hero image, heading or background, finishes rendering. In an Elementor build that can be a section background image uploaded at camera size or lazy loaded by mistake, waiting behind web fonts and CSS files; this dataset does not say how often.
That is good news. Hero loading is a kind of speed problem with clear first steps, and Elementor's own settings now address part of it, as check 6 covers. If your site fails on INP instead, the cause is more likely plugins and tracking scripts than the builder.

4. How much do Core Web Vitals weigh in Google rankings?
Core Web Vitals carry limited weight in Google rankings. Google confirms they feed its ranking systems, but says relevance comes first and good scores guarantee nothing. In practice speed works like a tiebreak between pages that answer a query equally well. A slow page with the best answer can still outrank a fast thin one.
Used in ranking: yes, confirmed by Google
Single page experience signal: no, Google says there is none
Other page experience aspects: do not directly raise rankings, per Google
Lab scores such as Lighthouse: not what Google ranks on
Where speed matters most: queries with many equally helpful pages
"Google Search always seeks to show the most relevant content, even if the page experience is sub-par," stated Google Search Central.
Google is also blunt that a passing report is not a ranking promise. Its page experience guide warns that good results in Search Console's Core Web Vitals report "doesn't guarantee that your pages will rank at the top of Google Search results." That line should end most arguments about chasing a 100 in PageSpeed Insights.
Here is how I weigh it for a B2B site. If you compete for a query where ten pages say roughly the same thing, a failing LCP is one more reason for Google to prefer someone else. If your page is the only one with real data or a specific answer, speed is unlikely to be what holds it back. Content quality, internal links and whether the page matches what the searcher wanted usually come first.
Speed matters for a second reason that has nothing to do with Google. It changes what visitors do once they arrive, and that is where most of the money sits. Check 7 covers the research on that.

5. What does your own site's field data show?
Your own field data is the speed number Google's ranking systems read, and you can see it free. Search Console's Core Web Vitals report and the field section of PageSpeed Insights both show real Chrome visits over 28 days. Pass means LCP of 2.5 seconds or less, INP of 200 milliseconds or less and CLS of 0.1 or less.
Where to look first: Search Console, Experience, Core Web Vitals, Mobile
Second source: PageSpeed Insights, the "Discover what your real users are experiencing" panel
Window: a rolling 28 days, so fixes show after about four weeks
Thresholds: LCP 2.5 s, INP 200 ms, CLS 0.1, all at the 75th percentile
Low-traffic sites: may show no field data, so use origin-level data instead
"Current practice is to resort to metrics, such as the document completion time (onLoad), that are simple to measure though knowingly inaccurate," wrote Bocchi, De Cicco and Rossi in ACM SIGCOMM Computer Communication Review, 2016, of Telecom ParisTech and Politecnico di Bari.
Most "Elementor is killing my SEO" posts quote the big coloured lab score at the top of PageSpeed Insights. That score comes from one simulated load on a throttled phone. It is useful for debugging, but it is not what Google ranks on, and it can swing noticeably from one run to the next. A site can score 45 in the lab and still pass in the field, because real visitors on fast phones and repeat visits load it faster.
So start with the field panel. If it says passed, Elementor is not your SEO problem, and you can stop reading here. If it says failed, note which metric failed and which URL groups in Search Console are affected. Usually it is one template, such as the homepage or a service page with a hero video, not the whole site. That tells you where to spend effort before anyone mentions a rebuild.

6. Which Elementor settings fix LCP first?
Start with the stable performance settings Elementor ships, then the hero image itself. In the Performance tab, turn on Optimized Image Loading, Lazy Load Background Images and Optimized Gutenberg Loading. In the Features tab, turn on Inline Font Icons. Then resize the hero image and move to better hosting if server response is slow.
Optimized Image Loading: marks the LCP image high priority and lazy loads the rest
Lazy Load Background Images: lazy loads every background image except the first
Inline Font Icons: renders icons as inline SVG instead of loading Font Awesome
Element Caching: still marked experimental by Elementor, so test before use
Outside Elementor: a hero exported at display size, fewer fonts, a faster host
"Improves performance by applying fetchpriority='high' on LCP images and loading='lazy' on images below the fold," stated Elementor's help center of its Optimized Image Loading setting, last updated 19 June 2026.
These settings map straight onto the LCP problem from check 3. A hero image that the browser treats as low priority, or lazy loads, arrives last. Telling the browser it matters first is a one-dropdown fix. Inline Font Icons removes a whole icon library and its CSS from every page, which shortens the queue in front of the hero.
Then fix what no setting can. Export the hero at the size it displays, in WebP or AVIF, and check it is an image element rather than a section background where you can. Cut web fonts to two families and the weights you use. Remove sliders and autoplay video from the first screen. Google treats a time to first byte of 0.8 seconds or less as good (web.dev). If your server is slower than that, no front-end change will rescue LCP, and managed WordPress hosting is the fix.
I would test each change on a staging copy first. Elementor itself suggests consulting an expert before making changes, and plugin conflicts are common. Then wait the 28 days for the field data to refresh before judging the result.

7. How slow is too slow for B2B buyers?
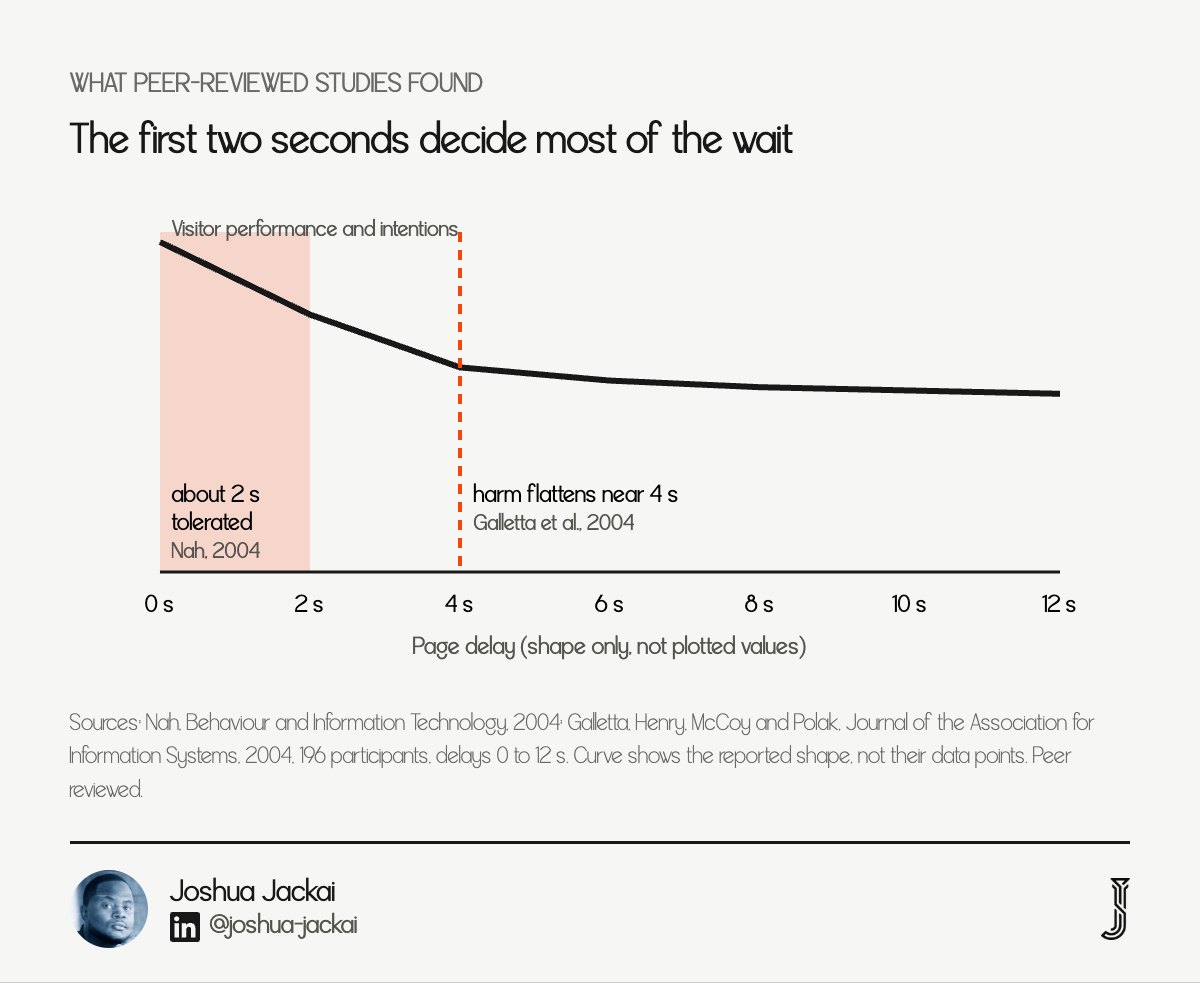
Web users tolerate about two seconds of waiting for information, and a peer-reviewed delay study found declines in performance and intentions begin to flatten after about four seconds. So the first two seconds of your hero decide most of what visitors think of the wait.
Tolerable wait for information retrieval: about 2 seconds, Nah 2004
Feedback effect: visible progress lengthens how long people will wait
Delay study: 196 participants, delays from 0 to 12 seconds, Galletta et al. 2004
Where damage flattens: about 4 seconds for performance and intentions
First impression of design: formed in about 50 milliseconds, Lindgaard et al. 2006
"Visual appeal can be assessed within 50 ms, suggesting that web designers have about 50 ms to make a good first impression," wrote Lindgaard, Fernandes, Dudek and Brown in Behaviour and Information Technology, 2006.
These studies are old and were run on desktop users, so I read them as direction, not thresholds. They still line up with Google's 2.5 second LCP mark. The Galletta, Henry, McCoy and Polak study in the Journal of the Association for Information Systems, 2004 gave 196 people delays from 0 to 12 seconds. It found that "decreases in performance and behavioral intentions begin to flatten when the delays extend to 4 seconds or longer." Put simply, by four seconds most of the harm is done.
For a B2B site, that matters most on pages paid traffic lands on. A buyer clicking a Google ad for "managed IT services Phoenix" decides in the first screen whether you look like a serious firm. Nah's finding about feedback is also practical. A hero heading that renders at once, with the image filling in after, feels faster than a blank screen waiting for a 2 MB background.
So the target is simple: the hero heading and offer visible within about two seconds on a mid-range phone. If your Elementor site does that, the builder is not costing you buyers.
8. When is rebuilding off Elementor worth it?
Rebuild only when two things are true at once. Your own field data still fails after the check 6 fixes and 28 days of new data, and you were due to redesign within about a year anyway. If only the first is true, keep fixing. If only the second is true, redesign in Elementor or move, your choice.
Condition 1: field LCP or INP still fails after the fixes and a full 28 days
Condition 2: a redesign was already planned for the next 12 months
Rebuild risk: URL changes, lost redirects and lost content during a migration
My builds: fixed price from $3,250, with redirects mapped before launch
Proof of pace: Snappy Kraken moved from Figma to HubSpot in 21 days
"Getting good results in reports like Search Console's Core Web Vitals report or third-party tools doesn't guarantee that your pages will rank at the top of Google Search results," stated Google Search Central.
The forum question behind this post is "should I ditch Elementor and rebuild?" My honest answer is usually not yet. A rebuild for speed alone swaps a known, fixable problem for a migration risk. Every changed URL needs a redirect, every page needs its title and content carried over, and every form needs its tracking reconnected. Done badly, a rebuild loses more rankings than a failing LCP ever cost.
The case changes when the site needs new structure anyway: new service pages, a new message, a CMS your team can use without breaking layouts. Then speed comes free with work you were doing regardless. That is the point to choose a faster platform, whether that is Bricks or GenerateBlocks on WordPress, or a hosted platform. I build on Framer, so weigh my view with that interest in mind, and note that HTTP Archive returned no Framer data for me to compare.
My website redesign cost guide prices the options, and my WordPress to Framer migration guide covers the redirect work.

Elementor vs Bricks: which performs better?
Bricks performs better than Elementor in field data. In September 2026, 68.4% of 1,925 US Bricks sites passed all three Core Web Vitals on mobile, against 55.6% of 86,228 Elementor sites. Bricks leads on LCP, 72.5% against 61.6%, and on CLS, 95.8% against 90.2%. Its sample is small and its users may skew technical.
The matrix sets every builder against the hosted platforms on the same US mobile data (HTTP Archive, 2026). The live page lets you filter it to WordPress builders or hosted platforms.
Builder | Type | All three pass | LCP good | INP good | CLS good | US origins |
|---|---|---|---|---|---|---|
Elementor | WordPress builder | 55.6% | 61.6% | 94.4% | 90.2% | 86,228 |
Divi | WordPress builder | 56.6% | 64.1% | 96.7% | 85.8% | 29,242 |
Oxygen | WordPress builder | 60.9% | 71.3% | 94.1% | 85.6% | 1,796 |
WordPress (all) | CMS | 62.0% | 70.4% | 92.6% | 88.1% | 352,468 |
Beaver Builder | WordPress builder | 67.7% | 72.3% | 97.2% | 93.7% | 12,301 |
GenerateBlocks | WordPress builder | 68.1% | 80.5% | 90.7% | 89.3% | 2,697 |
Bricks | WordPress builder | 68.4% | 72.5% | 95.9% | 95.8% | 1,925 |
Webflow | Hosted platform | 80.2% | 86.4% | 92.4% | 94.7% | 16,374 |
Shopify | Hosted platform | 85.5% | 92.1% | 95.1% | 94.2% | 118,969 |
Wix | Hosted platform | 88.7% | 91.6% | 96.6% | 98.4% | 37,229 |
Would fixing speed or rebuilding pay back faster?
A rough payback check helps before you commit. Divide the cost of each option by the extra monthly value you expect from it. The live page has a calculator for this. Use your own lead value and conversion rate, not mine, and treat the result as a ceiling, since speed is only one input.
Payback in months: option cost divided by (extra leads a month times value per lead)
Fix in place: usually hours of work plus hosting
Rebuild: from $3,250 on my fixed-price builds, plus migration time
What to plug in: your own visits, conversion rate and lead value
Methodology and limits
I pulled HTTP Archive's Core Web Vitals data for 15 technologies on 7 November 2026 through its public report API. The latest month was September 2026. I read United States mobile and desktop and the global figures, and US mobile for September 2025 and March 2026 for the trend. Framer, HubSpot CMS and WPBakery returned no rows.
The data counts origins, meaning whole sites, not pages, and a site counts as passing only when all three metrics are good at the 75th percentile of real Chrome visits. It cannot separate the builder from hosting, theme, plugins or the skill of whoever built the site. Small samples such as Bricks at 1,925 US origins can move several points between months. I found no controlled test that built the same site twice, and I ran none myself. The peer-reviewed waiting studies predate mobile browsing and are cited for direction only.
Frequently asked questions
Does Elementor hurt SEO?
Not by itself. Google says Core Web Vitals feed its ranking systems but that relevance comes first. Elementor's weak spot is load speed: 61.6% of US Elementor sites had good LCP on mobile in September 2026, against 70.4% for WordPress overall. Check your own field data before changing anything.
Is Elementor or Bricks faster?
Bricks sites pass Core Web Vitals more often, 68.4% against 55.6% on US mobile. The data cannot separate the builder from who uses it, so part of that gap may be who builds the site. Neither choice guarantees rankings. Pick Bricks for a new build, not as an emergency fix.
Does Elementor Pro help SEO?
No field data shows that it does. Elementor Pro is a design and site-building decision, and the HTTP Archive figures here do not split Pro from free sites. Speed settings such as Optimized Image Loading are documented in Elementor's help center. Your SEO plugin handles titles, schema and sitemaps.
Will switching from Elementor improve my rankings?
Only if speed is what holds you back, and often it is not. Google says it shows the most relevant content even when page experience is weak. Check your Search Console field data first. If it passes, a rebuild changes little; if it fails, try the fixes first.
Can an Elementor site pass Core Web Vitals?
Yes. More than half of US Elementor sites passed all three on mobile in September 2026, 55.6% of 86,228. I did not measure what passing sites share. Check 6 targets LCP, the metric Elementor sites miss most often, by speeding up how the hero loads.
How I would handle this on your site
I would open your Search Console Core Web Vitals report first, because it settles in minutes whether speed is a real problem. If it passes, content and internal links move rankings, and the builder can stay. If it fails, I would fix the hero and the Elementor settings in check 6, then wait 28 days.
If you are planning a redesign anyway, that is the moment to choose a faster setup, with every redirect mapped before launch. My free Pipeline Leak Scorecard shows where a site loses leads, speed included. I build fixed-price B2B sites from $3,250, and my signs you need a website redesign guide covers when a rebuild earns its cost.
Sources
Peer reviewed
Galletta, Henry, McCoy and Polak (2004). Web Site Delays: How Tolerant are Users? Journal of the Association for Information Systems, 5(1), 1-28. https://doi.org/10.17705/1jais.00044
Nah (2004). A study on tolerable waiting time: how long are Web users willing to wait? Behaviour and Information Technology, 23(3), 153-163. https://doi.org/10.1080/01449290410001669914
Lindgaard, Fernandes, Dudek and Brown (2006). Attention web designers: You have 50 milliseconds to make a good first impression! Behaviour and Information Technology, 25(2), 115-126. https://doi.org/10.1080/01449290500330448
Bocchi, De Cicco and Rossi (2016). Measuring the Quality of Experience of Web users. ACM SIGCOMM Computer Communication Review, 46(4), 8-13. https://doi.org/10.1145/3027947.3027949
Industry and vendor (not peer reviewed, read 7 November 2026)
HTTP Archive, Technology Report, Core Web Vitals by technology, September 2026 data. https://httparchive.org/reports/techreport/tech
Google Search Central, Understanding page experience in Google Search results. https://developers.google.com/search/docs/appearance/page-experience
Google, web.dev, Web Vitals thresholds. https://web.dev/articles/vitals
Google, web.dev, Time to First Byte. https://web.dev/articles/ttfb
Elementor, Improve performance features, last updated 19 June 2026. https://elementor.com/help/what-are-performance-experiments/
Free workbook
Pipeline Leak Scorecard
Find the leaks between your traffic and your pipeline. Score your site in about fifteen minutes, with it open in front of you.
12 questions, 8 pages, 15 minutes. Free.