Social Media Marketing
Paid Ads & Creative
How to Measure Social Media ROI for B2B Service Firms

Joshua Jackai
10 min

To measure social media ROI, subtract everything you spent on social media from the profit it brought in, then divide by what you spent. The formula is the easy part. The hard part is counting the full cost, connecting a post or ad to a deal that closed six weeks later, and not believing numbers that give social credit for sales that would have happened anyway. This guide is for founders and marketing leads at B2B service companies in the US and abroad who want a social media ROI figure they can defend in a budget meeting. It covers the formula, what to count, how to track it, and how to test what social media actually adds.
The social media ROI formula
Social media ROI = (return from social media − cost of social media) ÷ cost of social media × 100.
Both halves need care:
Return should be gross profit from deals that social media helped win, not revenue and not likes. If a $20,000 project costs you $8,000 to deliver, the return is $12,000.
Cost should be everything: ad spend, tools, creative production and the hours your team spends planning, posting and replying.
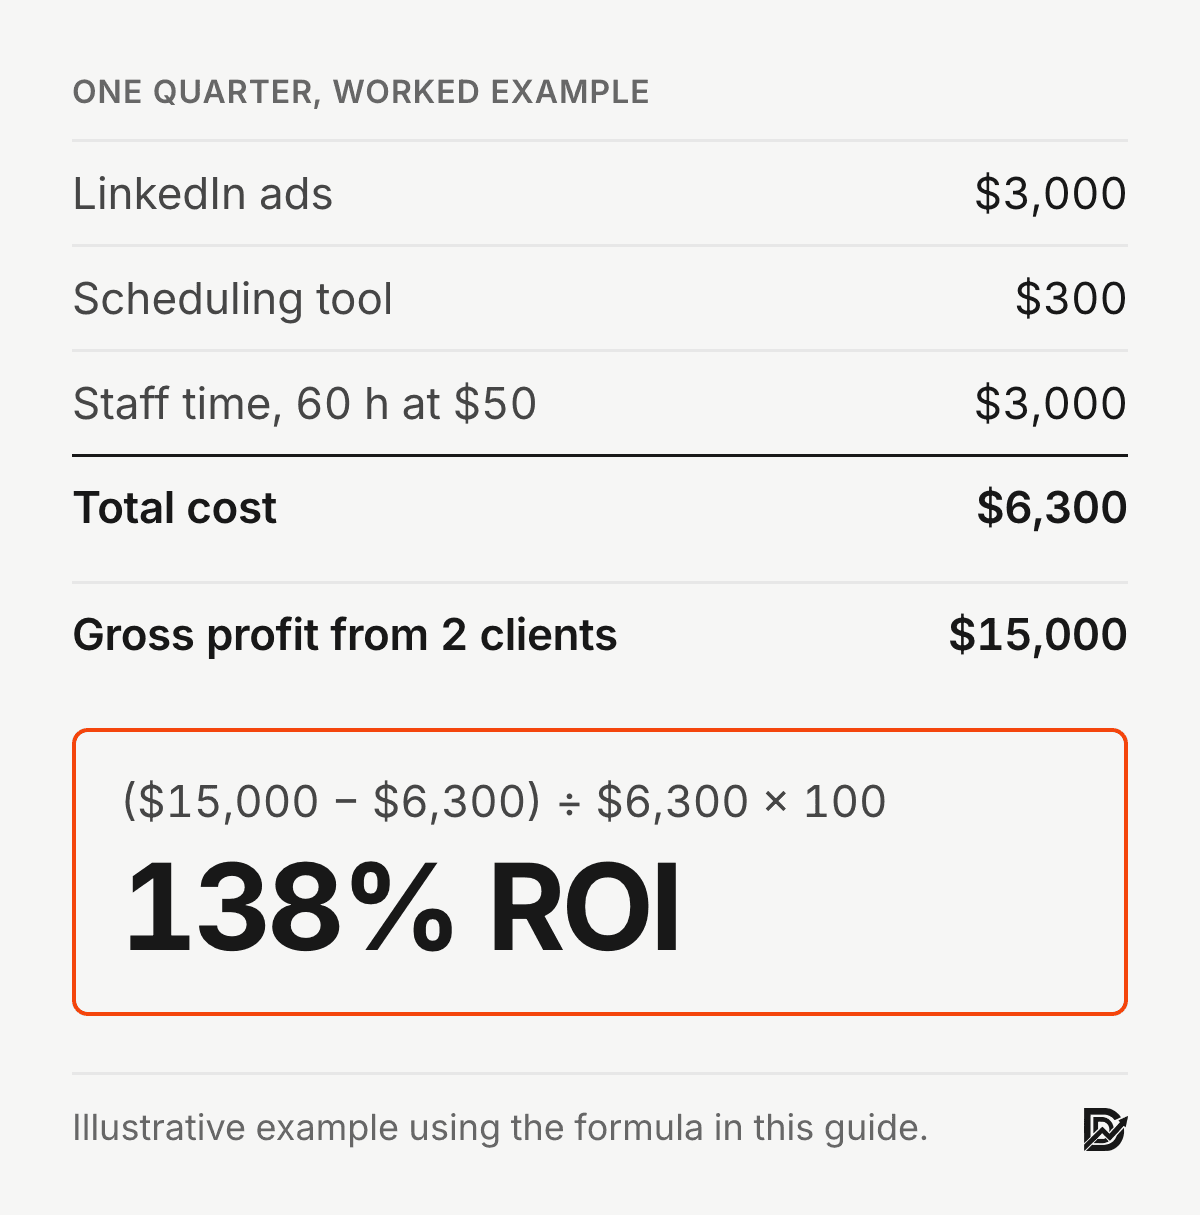
Here is a simple example. Over a quarter you spend $3,000 on LinkedIn ads, $300 on a scheduling tool and 60 hours of staff time worth $50 an hour, so $3,000 more. Total cost: $6,300. Social media sourced two clients whose projects bring in $15,000 of gross profit. ROI = ($15,000 − $6,300) ÷ $6,300 × 100, or about 138%.
Two other numbers often get confused with ROI:
ROAS (return on ad spend) is revenue divided by ad spend. It ignores every cost except the ads.
Cost per lead or cost per acquisition tells you what each lead or client cost, but not whether they were worth it.
All three are useful. Only ROI tells you whether social media made you money.
Why ROAS is not ROI: a real campaign
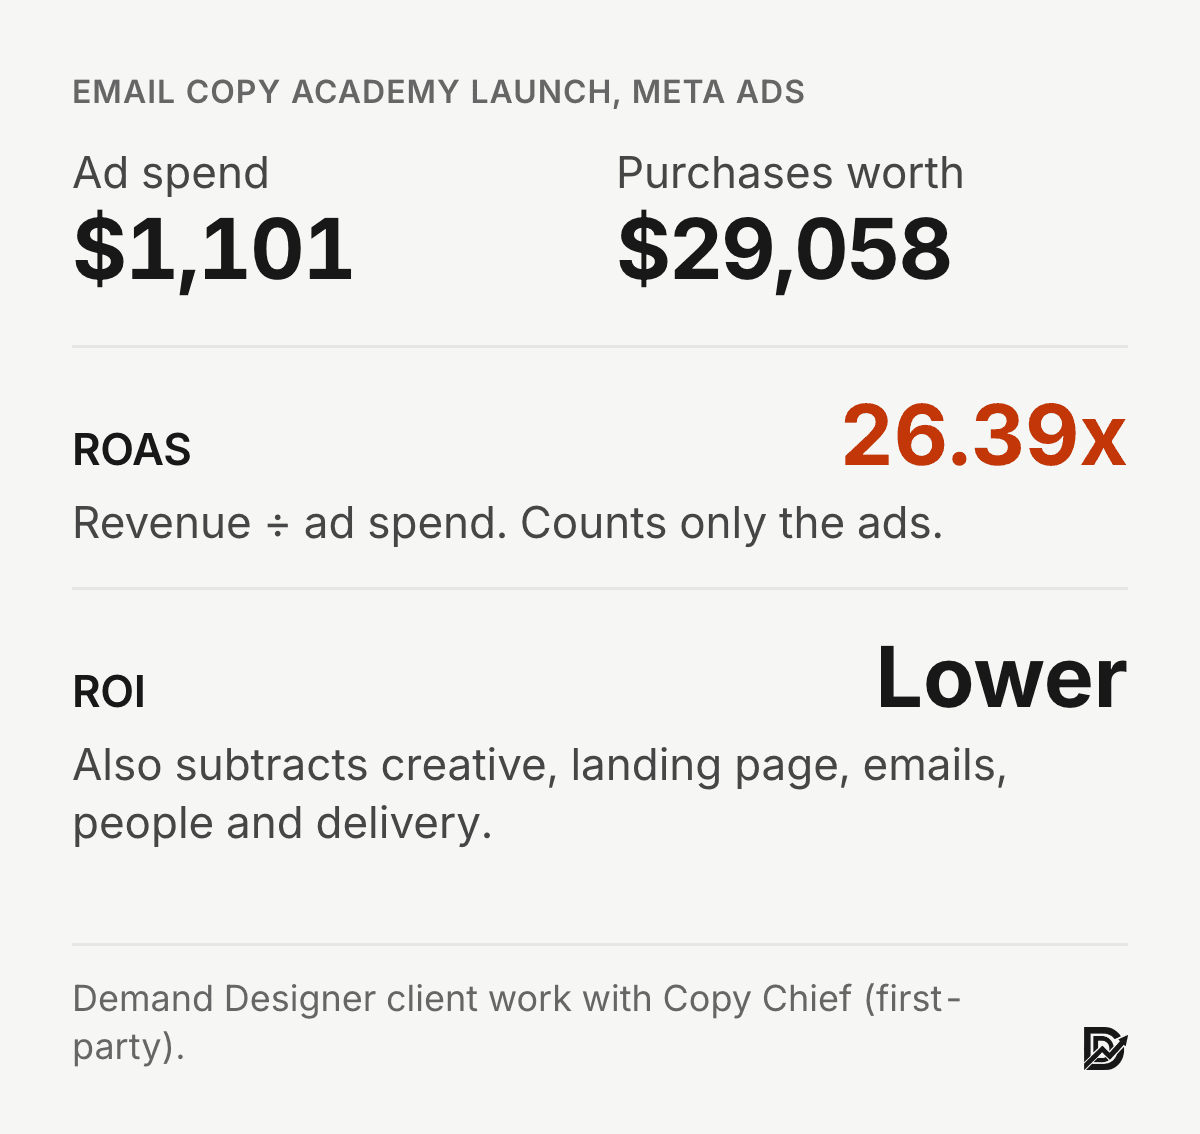
One of my own campaigns shows the gap. For the Email Copy Academy launch with Copy Chief, Meta ads cost $1,101.17 and drove 65 purchases worth $29,058. That is a ROAS of 26.39x, a strong result by any standard.
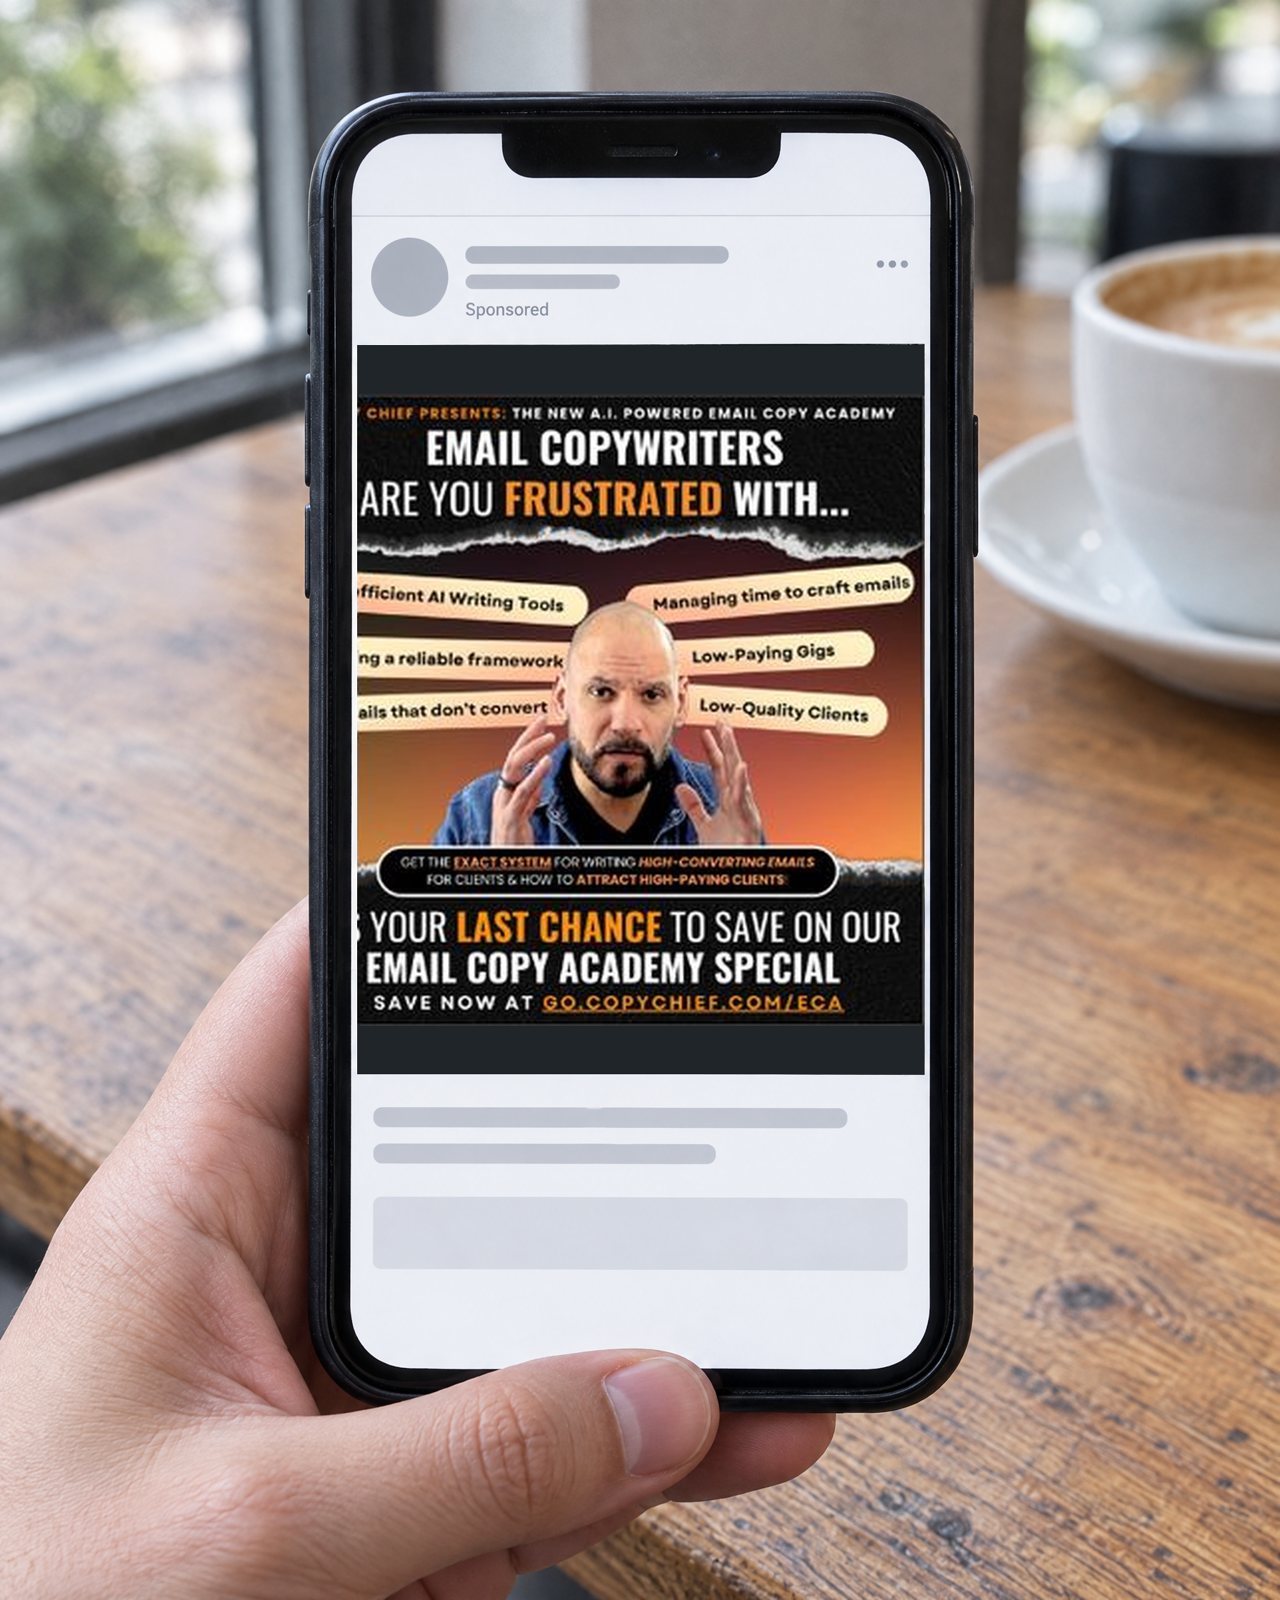
The real Email Copy Academy ad, shown in an illustrative scene.
It is not an ROI of 26.39x. Take away the ad spend and you get 25.4 times the spend in revenue above it, before counting the creative, the landing page, the email sequence, the people who built them, and the cost of delivering the product. The true ROI was still excellent, but lower. If you report ROAS as ROI, someone in finance will eventually notice, and every number you report after that gets discounted.
Why platform-reported numbers usually run high
The conversion numbers inside Meta, LinkedIn and Google ads managers are a starting point, not a verdict. Each platform counts conversions after someone saw or clicked an ad, and each one claims the credit, so the same client can be counted by three platforms at once.
The deeper problem is that some of those buyers would have bought anyway. Researchers at Facebook and Northwestern compared ordinary measurement methods with randomized experiments across large Facebook ad campaigns, where some people were held back from seeing the ads. The ordinary methods often overstated the true effect of the ads, in some campaigns by several times (Gordon et al., 2019). A large experiment at eBay found the same pattern in paid search: when the company stopped its brand keyword ads, almost all of that traffic still arrived through the free search results (Blake, Nosko and Tadelis, 2015).
Measurement is also noisy. Across 25 large field experiments on online ads, sales varied so much from person to person that even campaigns reaching very large audiences often could not show whether they were profitable (Lewis and Rao, 2015). If big advertisers with millions of impressions struggle, a B2B firm with a few dozen deals a year should be humble about any single number.
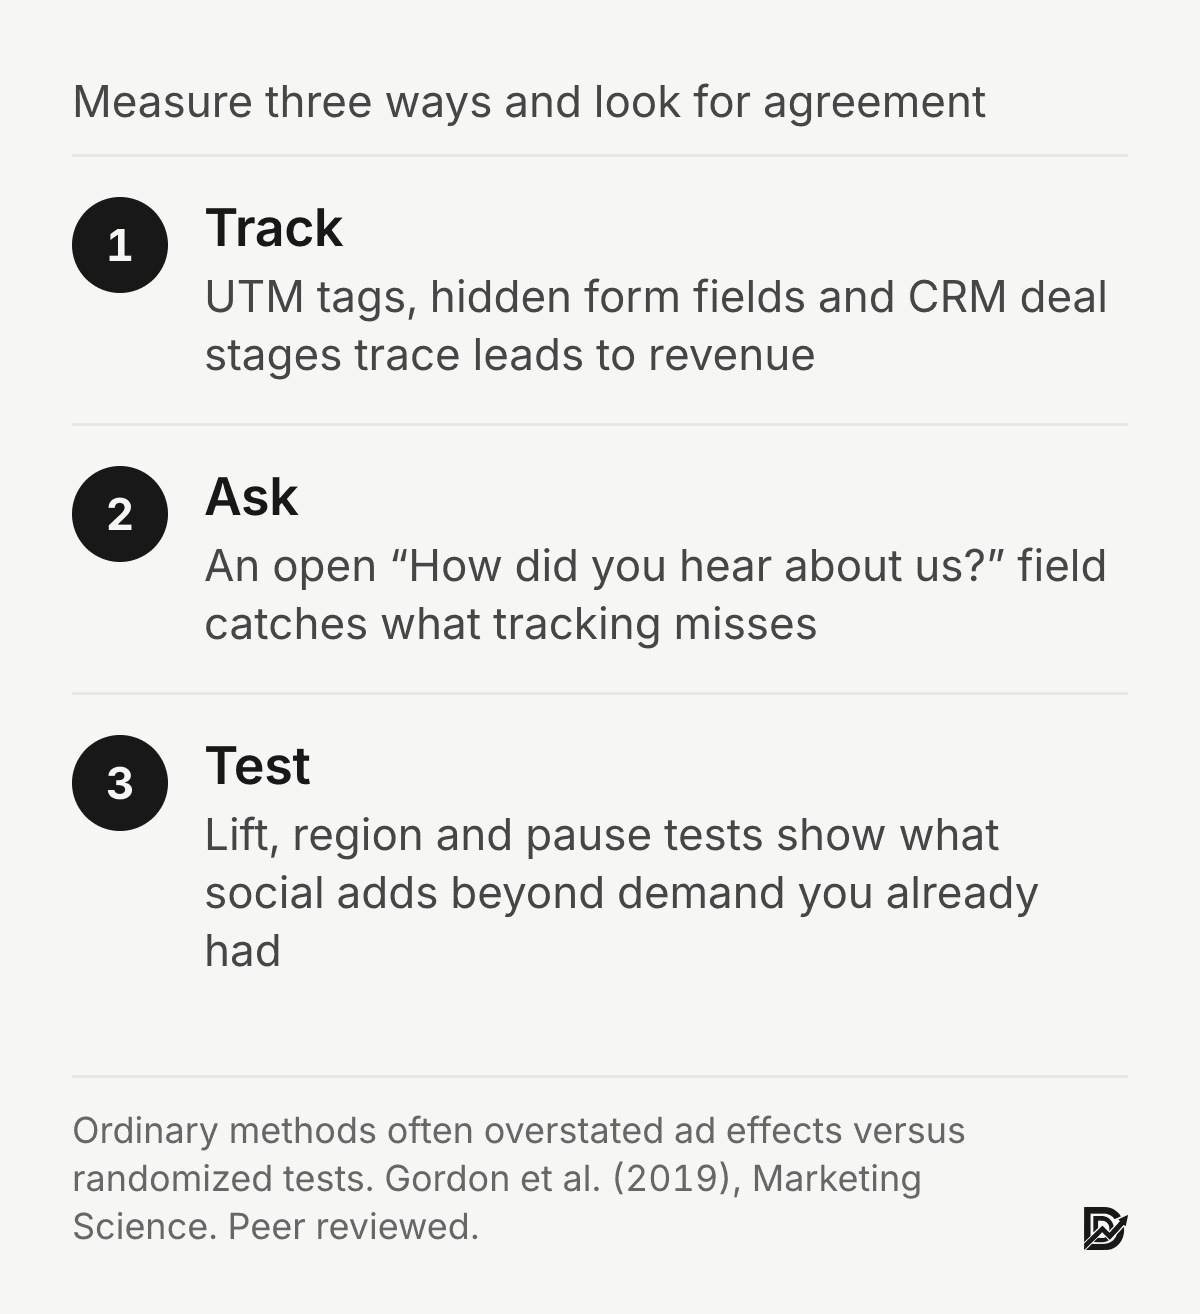
None of this means social media does not work. It means you should measure it in more than one way and look for agreement.
Step 1: Decide what counts as a return
Before you track anything, write down what a return is for your business. For a B2B service firm, I use three levels:
Pipeline: qualified leads and sales conversations that came from social media.
Revenue: deals won from those conversations.
Profit: the gross profit on those deals, which goes into the ROI formula.

Illustrative photo.
Awareness metrics, such as reach, impressions and follower growth, are not returns. They can be useful early signals, and I cover how to use them below, but they do not go into an ROI calculation. Brands that report them as ROI are measuring activity, not results.
Set the measurement window to match your sales cycle. If deals take eight weeks to close, judge a campaign that ran in March in May or June, not at the end of March.
Step 2: Count the full cost
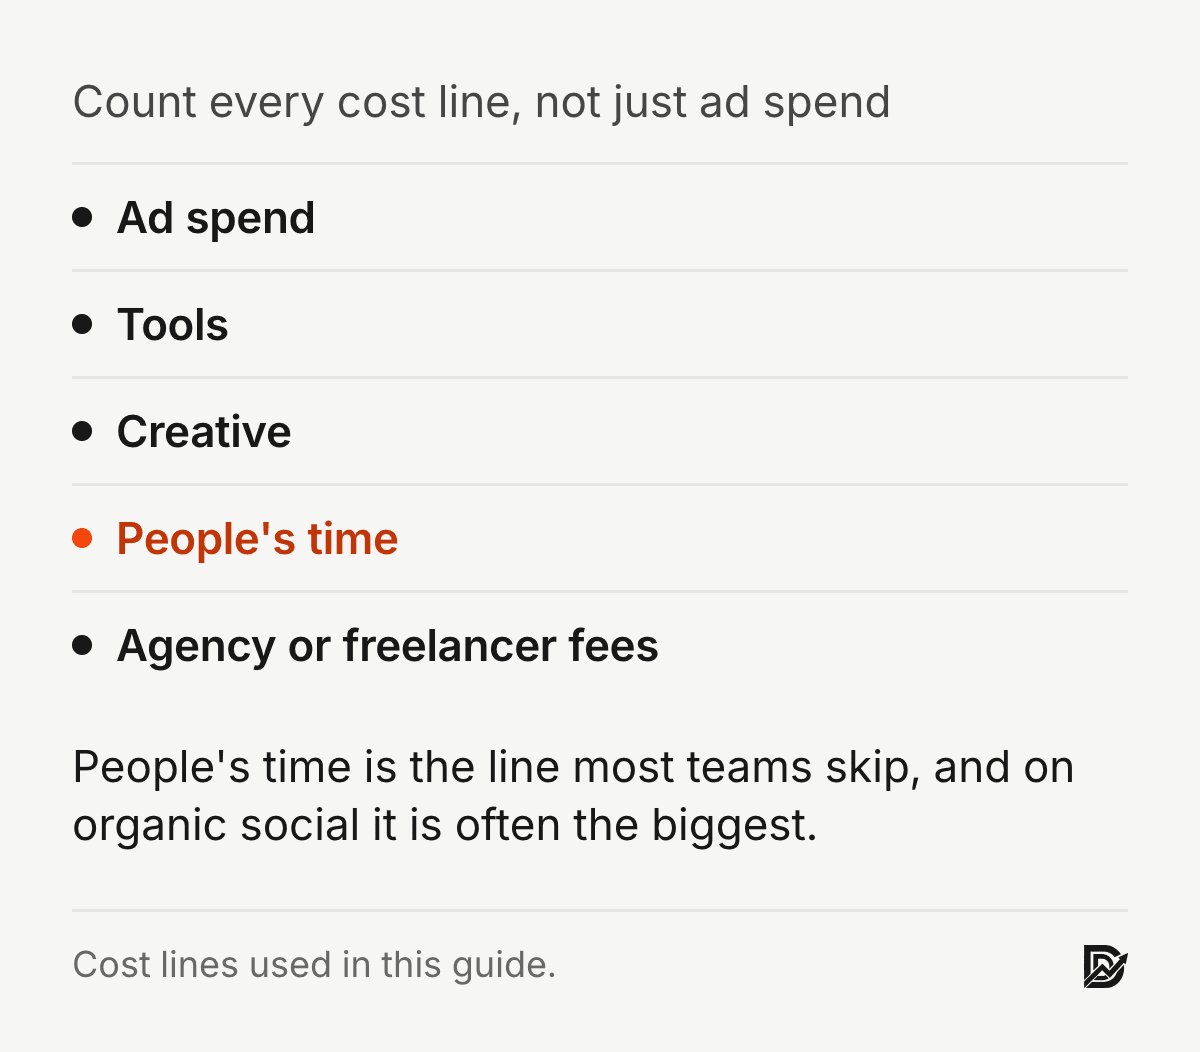
Most social media ROI figures look better than they are because they only count ad spend. List every cost for the period:
Ad spend on every platform.
Tools: scheduling, design, analytics and any paid social listening.
Creative: design, video editing, photography and copywriting, whether in-house or outsourced.
People: hours spent planning, posting, replying to comments and messages, and reporting, multiplied by a fair hourly cost.
Agency or freelancer fees.
The people line is the one most teams skip, and on organic social it is often the biggest cost.
Step 3: Tag every link and connect it to your CRM
You cannot measure a return you cannot trace. Three pieces of setup make social media leads traceable:
UTM tags on every link. Add utm_source (linkedin, instagram), utm_medium (paid or organic) and utm_campaign to every link you post or advertise, so Google Analytics 4 records where each visit came from. Keep the names consistent; "LinkedIn" and "linkedin" show up as two sources.
Hidden form fields. Pass the UTM values into hidden fields on your forms, so each lead arrives in your CRM with its source attached.
Deal stages in the CRM. Track each lead through to won or lost, with the deal value. HubSpot, Pipedrive and most other CRMs can report revenue by original source once the fields are in place.
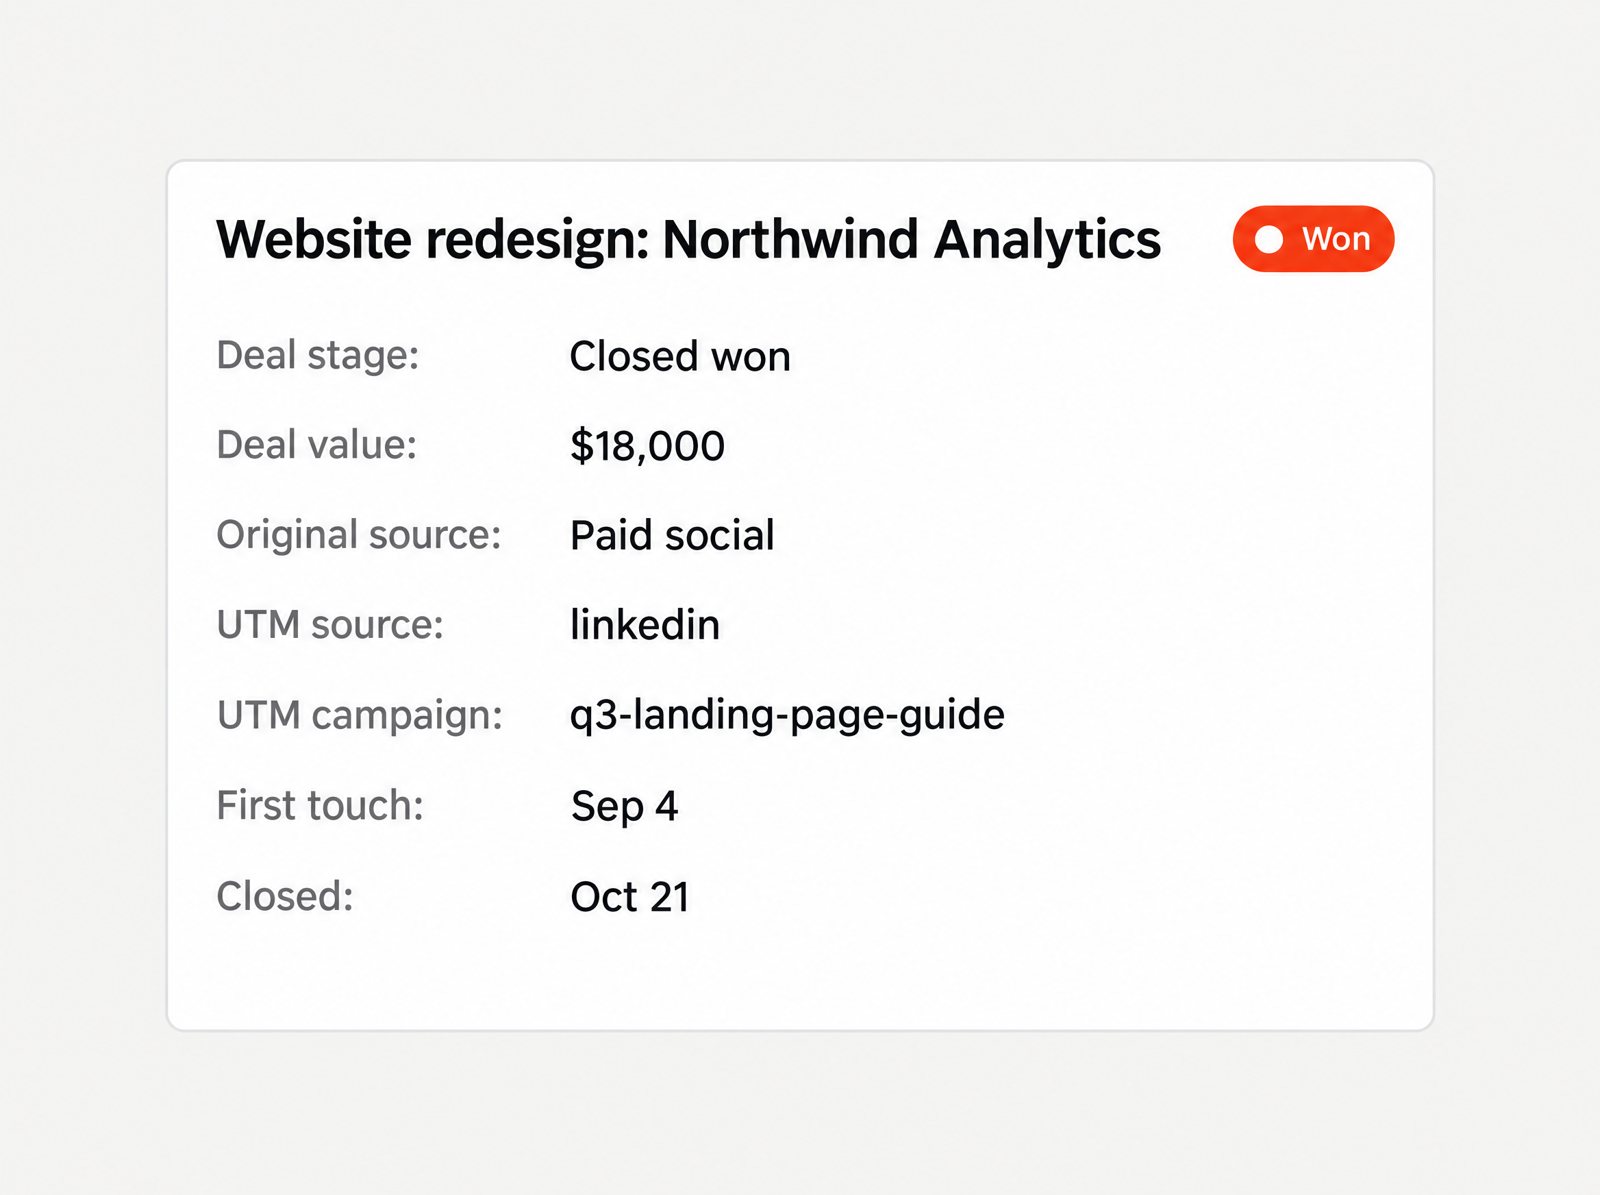
Illustration with example data: what a social media sourced deal looks like in a CRM once UTM fields flow through.
If you run ads, also send conversion events back to the ad platforms, such as Meta's Conversions API or LinkedIn's conversion tracking, so they optimize for leads that become sales conversations rather than for cheap clicks.
Step 4: Ask buyers where they heard about you
Tracking links miss a lot of how B2B buyers actually find you. Someone sees your post on LinkedIn, mentions you in a team chat, and a colleague searches your name two weeks later. Analytics records that as a search visit. Social media did the work and gets no credit.
The simplest fix is to ask. Add a required, open text field to your booking form: "How did you hear about us?" Then read the answers every month and group them. An open field works better than a dropdown, because people type things you would never list, such as a specific post, a podcast or a colleague's name.
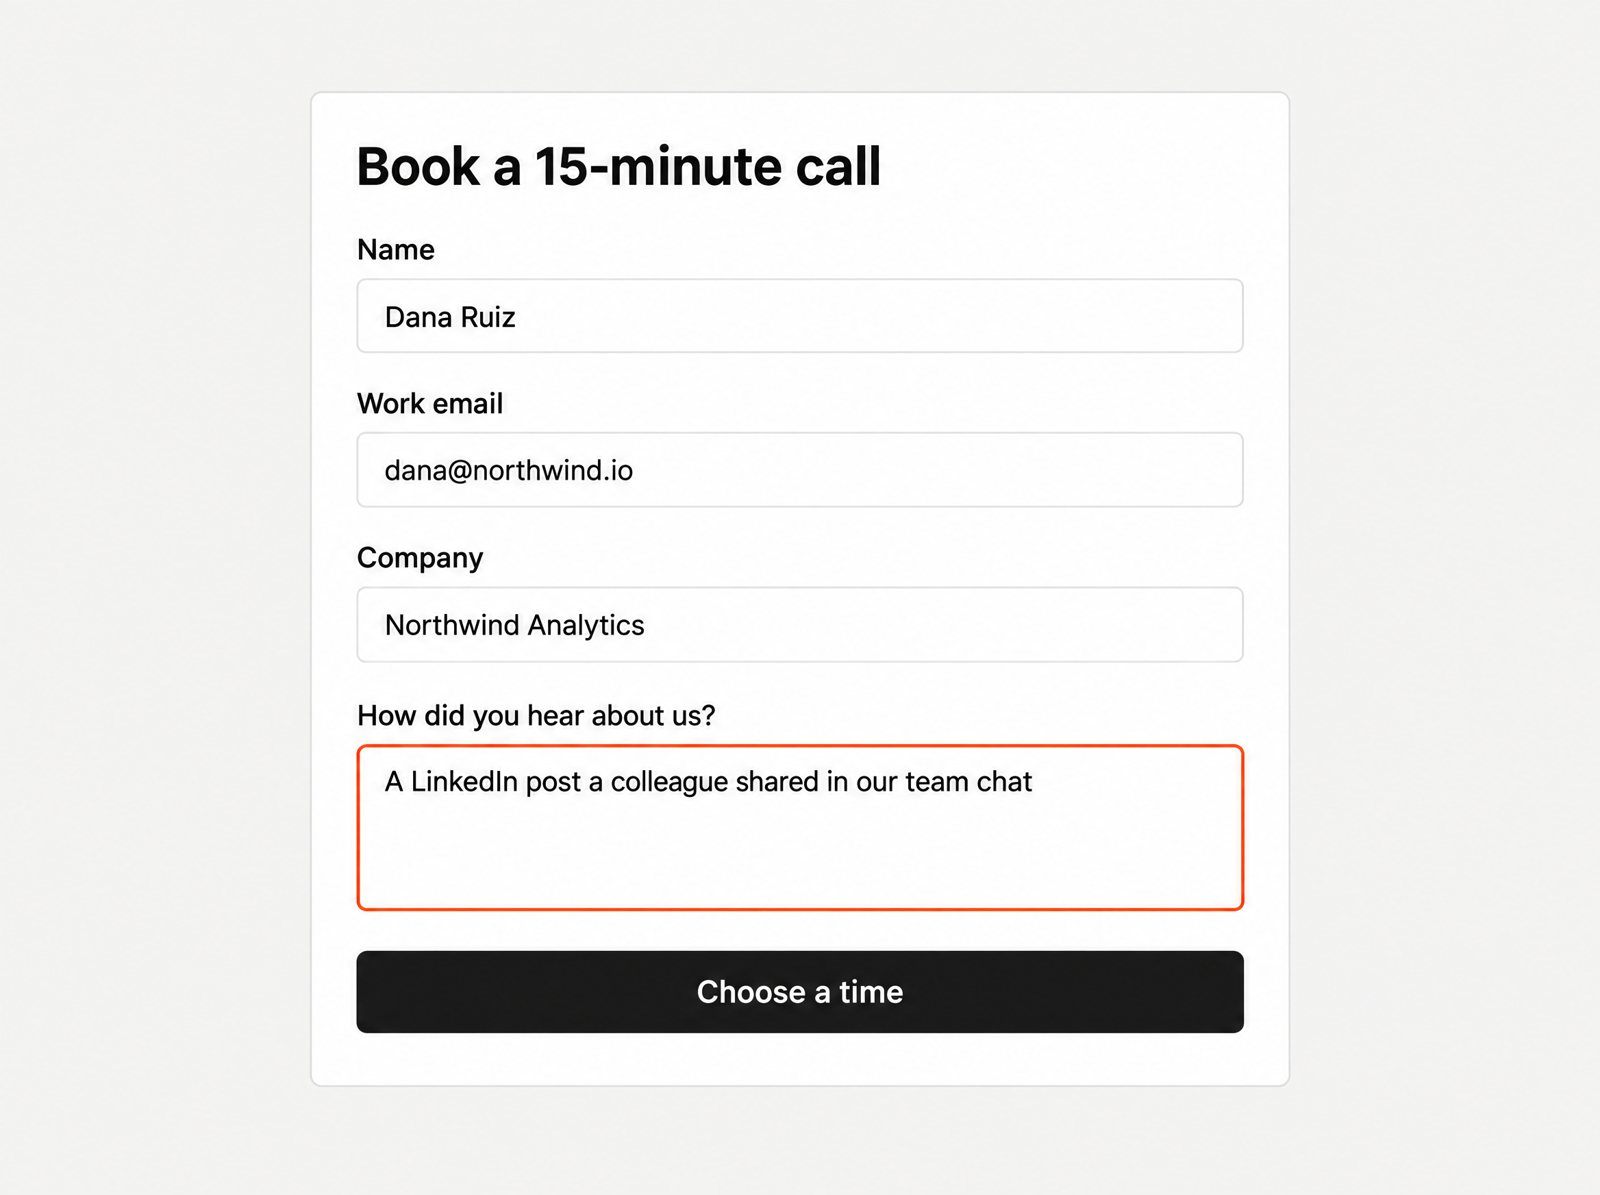
Illustration with example data: an open How did you hear about us? field on a booking form.
Compare what buyers say with what your tracking says. Where they agree, you can be confident. Where they differ, the answers usually point to the channels your tracking cannot see.
Step 5: Test what social media adds
The most honest way to measure social media ROI is to compare results with and without it. You do not need a research team to do a rough version:
Platform lift tests. Meta and some other platforms offer conversion lift studies that hold back a random group from seeing your ads and compare the two groups. They need a reasonable budget and volume to give a clear answer.
Region tests. If you sell in several regions, run a campaign in some and not others for a full sales cycle, and compare leads per region against the previous period.
Pause tests. Pause a campaign you are unsure about for four to eight weeks and watch total qualified leads, not just tracked social leads. If nothing drops, the campaign was probably taking credit for demand you already had.
Be careful with small numbers. If you win five clients a quarter, one extra client either way can look like a big effect. Run tests for long enough, and judge them alongside your tracking and your buyers' answers, not alone.
Step 6: Judge organic social on its own terms
Organic posting is harder to tie to revenue than ads, but it does affect what customers spend. A study of a retailer's customers found that those who engaged with the company's own social media posts went on to spend more, even after accounting for their other contact with the brand (Kumar et al., 2016).
For a B2B service firm, I track organic social with a short list of leading signals, reviewed monthly:
Profile visits and follows from people who match your buyer, by job title and company size.
Comments and direct messages from potential clients, not peers.
Growth in searches for your company name, from Google Search Console.
Mentions in the "How did you hear about us?" field.
When those signals rise and qualified leads follow over the next one to two sales cycles, organic social is earning its keep, even if few leads arrive with a tracked link.
Social media ROI metrics that matter
Here are the metrics I use, grouped by what they tell you:
Cost: total cost, cost per qualified lead, cost per client won.
Pipeline: qualified leads, sales conversations booked, pipeline value from social media.
Revenue: deals won, revenue and gross profit from social media sourced and social media influenced deals.
Efficiency: ROI, ROAS on paid campaigns, and the time from first social touch to signed deal.
Leading signals: buyer profile visits, replies and messages, branded search growth, self-reported mentions.
Report social media sourced (the first recorded touch was social) and social media influenced (social appeared anywhere in the path) separately. The first is conservative; the second is generous. The truth sits between them.

Tools to measure social media ROI
There is no single best tool to measure social media ROI, because the return lives in your sales data, not in your social accounts. The tools that matter, in order:
Your CRM (HubSpot, Pipedrive, Salesforce or similar), for leads, deals and revenue by source. This is the one you cannot skip.
Google Analytics 4, for traffic and conversions by UTM source and campaign.
The native ads managers (Meta, LinkedIn, TikTok), for spend, cost per result and lift studies.
Native analytics on each platform, for organic reach, engagement and audience makeup.
A spreadsheet, honestly, for combining cost, pipeline and profit into one monthly ROI figure.
Social media management suites can pull the platform data together, which saves time. They cannot see your deals unless they connect to your CRM, so check that before paying for one.
When to cut, keep or scale a campaign
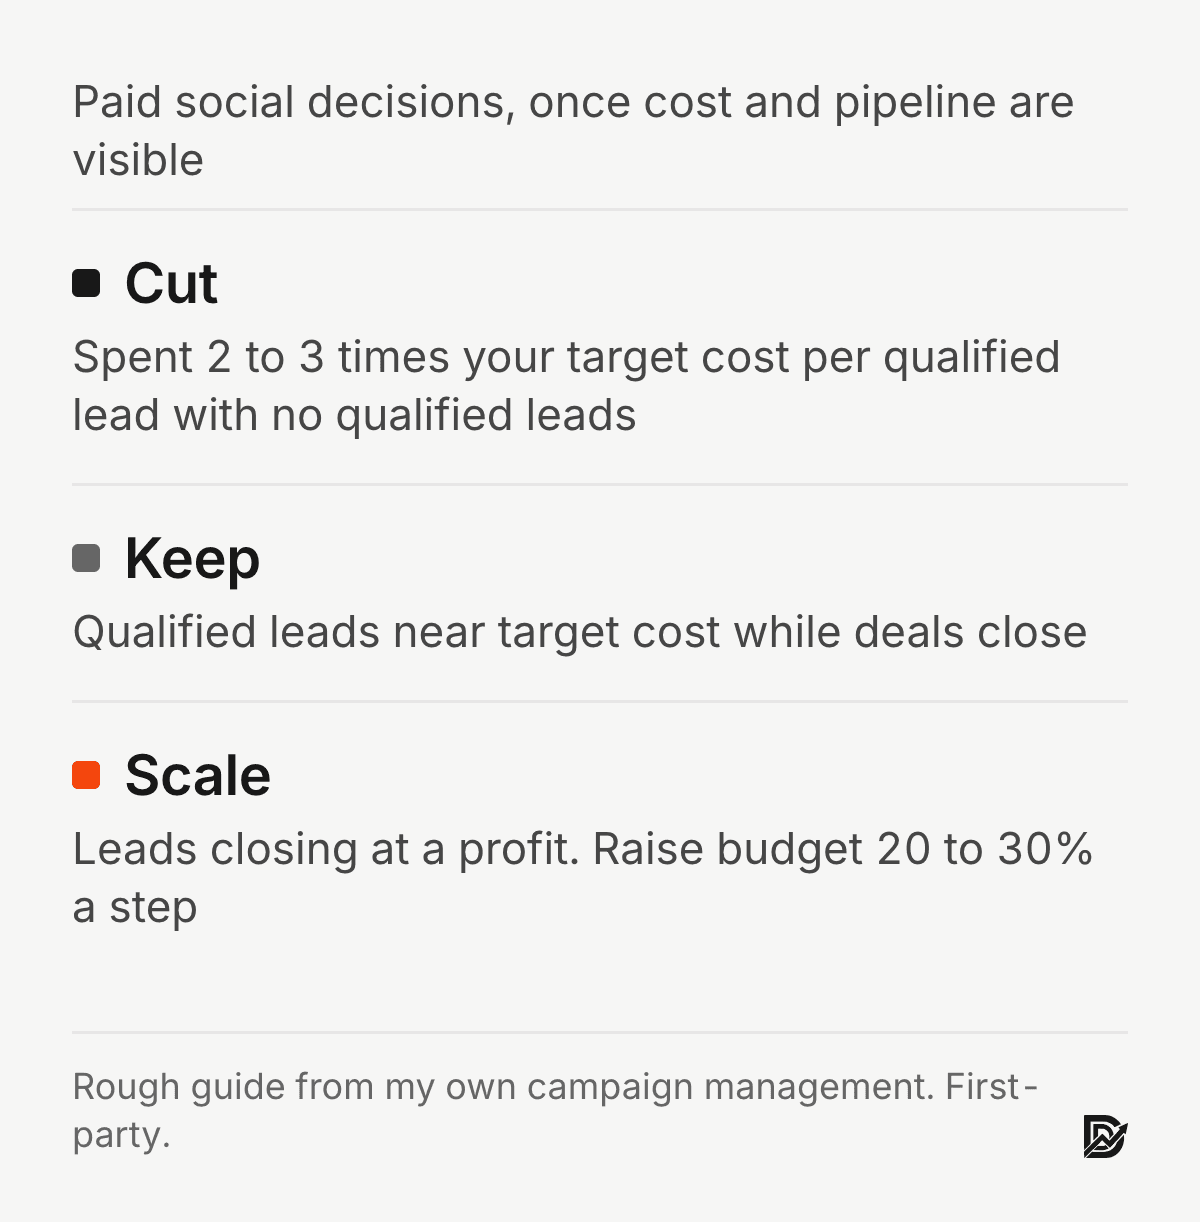
Once you can see cost, pipeline and profit by campaign, decisions get simpler. As a rough guide for paid social:
Cut a campaign that has spent two to three times your target cost per qualified lead with no qualified leads.
Keep a campaign that is producing qualified leads near your target cost, while you wait for deals to close.
Scale a campaign whose leads are closing at a profit, in steps of 20 to 30% of budget, checking cost per lead after each step.
The Kill Sheet gives you thresholds for the five signals that matter and a ten-minute weekly routine for making these calls without guessing. If your ads send people to a page that does not convert, the ad will look worse than it is. B2B conversion rate optimization covers that side. The anatomy of a high-converting B2B landing page shows what the page itself needs.
Measuring social media alongside SEO and other channels
Buyers rarely use one channel. A prospect may find a blog post through search, follow you on LinkedIn, and book after an email. To compare channels fairly, use the same rules for all of them: the same definition of a qualified lead, the same cost lines including people's time, and the same measurement window. Then compare cost per qualified lead and profit per channel side by side. For the strategy side, see how to build a social media strategy.
Frequently asked questions
What is a good social media ROI?
Any ROI above zero means social media returned more profit than it cost. For B2B service firms, a useful test is whether social media brings in clients at a cost per client below what you pay through other channels. Compare it with your own alternatives, not with industry averages.
Can you measure the ROI of organic social media?
Partly. Track tagged links and self-reported sources for direct results, and leading signals such as buyer profile visits, messages and branded search for indirect ones. Include the staff time in the cost, since it is usually the biggest expense in organic social.
How long does social media take to show ROI?
Expect at least one full sales cycle before you can judge a campaign. For most B2B services that means two to three months. Paid campaigns show leads within weeks; won revenue takes longer.
What is the best tool to measure social media ROI?
Your CRM. Social media tools report reach and clicks, but the return is in deals and profit, which only your CRM records. Pair it with Google Analytics 4 and consistent UTM tags.
How do I track social media spend against ROI?
Keep one monthly sheet with every cost line, including tools and staff hours, next to qualified leads, deals won and gross profit by channel. Calculate ROI from the profit and the full cost, not from ad spend alone.
Sources
Peer-reviewed research
Blake, T., Nosko, C. and Tadelis, S. (2015). Consumer heterogeneity and paid search effectiveness: A large-scale field experiment. Econometrica, 83(1). doi:10.3982/ECTA12423
Gordon, B. R., Zettelmeyer, F., Bhargava, N. and Chapsky, D. (2019). A comparison of approaches to advertising measurement: Evidence from big field experiments at Facebook. Marketing Science, 38(2). doi:10.1287/mksc.2018.1135
Kumar, A., Bezawada, R., Rishika, R., Janakiraman, R. and Kannan, P. K. (2016). From social to sale: The effects of firm-generated content in social media on customer behavior. Journal of Marketing, 80(1). doi:10.1509/jm.14.0249
Lewis, R. A. and Rao, J. M. (2015). The unfavorable economics of measuring the returns to advertising. The Quarterly Journal of Economics, 130(4). doi:10.1093/qje/qjv023
First-party data (not peer reviewed)
Email Copy Academy campaign figures are from my own client work with Copy Chief.
Free workbook
The Kill Sheet
Know when to kill an ad and when to let it run, with thresholds for the five signals that matter.
Five signals, three verdicts, ten minutes every Monday. Free.


